


Bitcoin Cash (BCH) Price Predictions / Bitcoin Cash (BCH) Forecast
| After | Price | Change |
|---|---|---|
| 1 day | $442.4259 | 0.71% |
| 1 week | $439.5217 | 0.05% |
| 1 month | $444.8565 | 1.27% |
| 6 months | $640.7819 | 45.87% |
| 1 year | $1,033.5799 | 135.28% |
| 5 years | $3,406.9172 | 675.55% |
The Relative Strength Index (RSI) is an important indicator for measuring the speed and variation of price movements. Its value ranges from zero and 100. The value around 30 and below is considered an oversold region and over 70 as oversold regions. Relative Strength Index is indicating Neutral action, with value at 40.3.
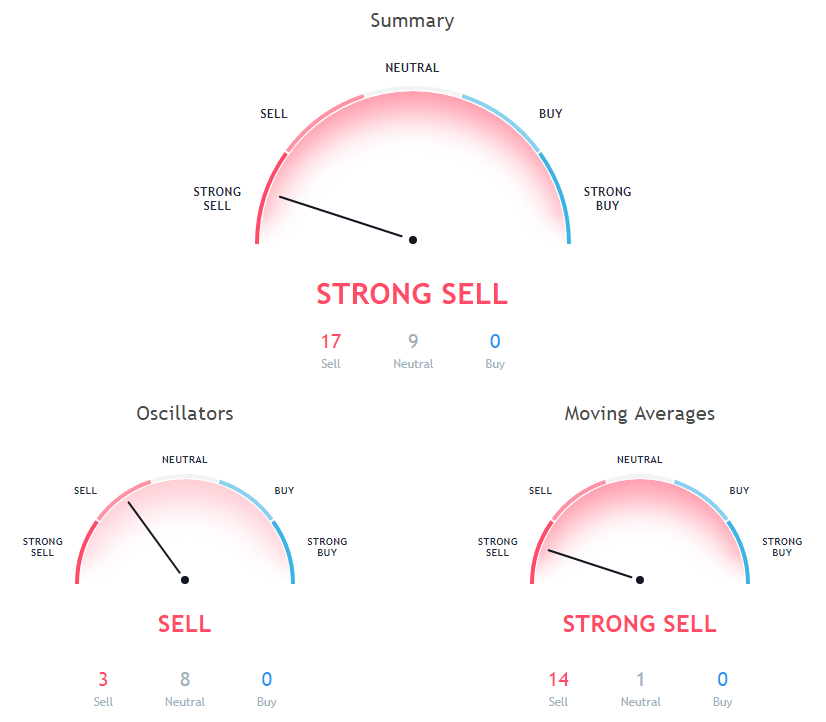
The Commodity Channel Index (CCI) is a momentum-based technical trading tool used to determine when a market is overbought or oversold. Commodity Channel Index is showing Neutral signal, with value at -86.9.
The stochastic oscillator is a momentum indicator that compares the closing price of a security with the price range over a specific period. Stochastic oscillator is showing Neutral signal, with value at 21.6.
9 days Ichimoku Cloud Base Line is indicating Neutral since Bitcoin Cash is trading at $439.29, below MAs value of 506.8. 50 days Exponential Moving Average is indicating Sell since Bitcoin Cash is trading at $439.29, below MAs value of 509.3. 30 days Exponential Moving Average is at 486.6, showing Sell signal, Bitcoin Cash is trading below it at $439.29.
100 days Exponential Moving Average is indicating Sell action with value at 593.3, Bitcoin Cash is trading below it at $439.29. 200 days Exponential Moving Average is at 727.6, showing Sell signal, Bitcoin Cash is trading below it at $439.29. 50 days Simple Moving Average is indicating Sell action with value at 496.3, Bitcoin Cash is trading below it at $439.29.
9 days Hull Moving Average is indicating Sell action with value at 455, Bitcoin Cash is trading below it at $439.29. 30 days Simple Moving Average is indicating Sell since Bitcoin Cash is trading at $439.29, below MAs value of 494.1. 10 days Simple Moving Average is indicating Sell action with value at 458.5, Bitcoin Cash is trading below it at $439.29.
10 days Exponential Moving Average is at 464, showing Sell signal, Bitcoin Cash is trading below it at $439.29. 200 days Simple Moving Average is at 802.3, showing Sell signal, Bitcoin Cash is trading below it at $439.29. 20 days Volume Weighted Moving Average is at 487.5, showing Sell signal, Bitcoin Cash is trading below it at $439.29.
Also Read: Beginner’s Guide to Cryptocurrency Wallets
20 days Exponential Moving Average is at 477.7, showing Sell signal, Bitcoin Cash is trading below it at $439.29. 20 days Simple Moving Average is indicating Sell since Bitcoin Cash is trading at $439.29, below MAs value of 491. 100 days Simple Moving Average is indicating Sell since Bitcoin Cash is trading at $439.29, below MAs value of 581.9.
Other Technical Price Analysis for today:
Bitcoin (BTC) Volume Approaches Yearly Low Yet Again - Bitcoin Price Analysis - 19 Oct 2018
Tron (TRX) Price Remains Constant With Lack Of Momentum - Tron Price Analysis - 19 Oct 2018

