


Bitcoin (BTC) Price Predictions / Bitcoin (BTC) Forecast
| After | Price | Change |
|---|---|---|
| 1 day | $6,613.4261 | 0.18% |
| 1 week | $6,680.4907 | 1.20% |
| 1 month | $6,640.5262 | 0.59% |
| 6 months | $7,222.9534 | 9.42% |
| 1 year | $9,517.7155 | 44.18% |
| 5 years | $24,145.8993 | 265.77% |
We've applied Technical Analysis to the price of Bitcoin (BTC/USD) for today and predict where price is headed.
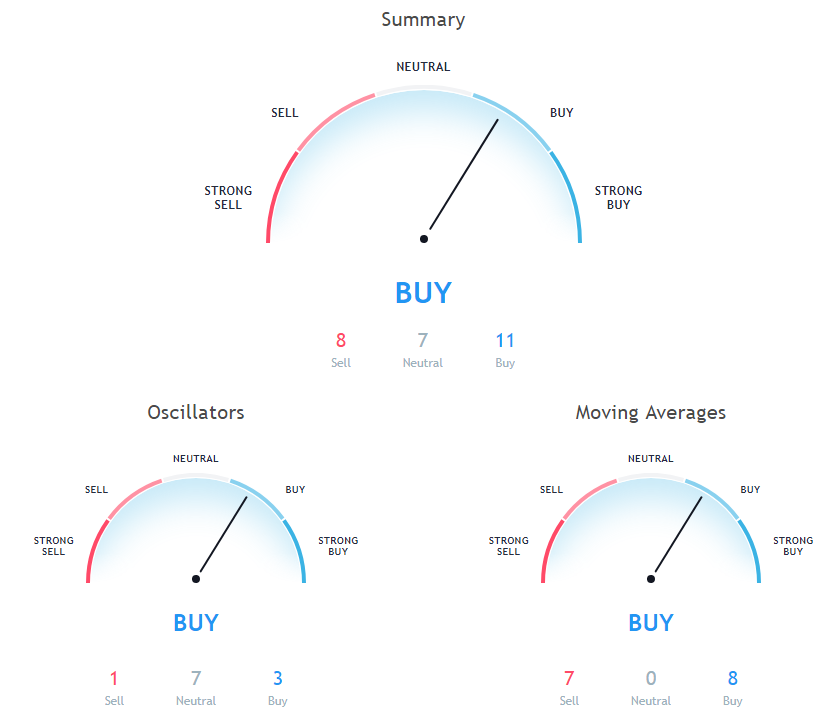
The Stochastic Oscillator is a range bound momentum oscillator. Stochastic oscillator is showing Neutral signal, with value at 56.3.
The Commodity Channel Index (CCI) is a momentum oscillator used in technical analysis to measure an instrument's deviation from its statistical average. Commodity Channel Index is at 33.2, indicating Neutral action.
Relative Strength Index (RSI) is an important indicator that measures speed and change of price movements. Its value ranges between zero and 100. Value around 30 and below is considered oversold region and around 70 and above considered overbought regions. Relative Strength Index is showing Neutral signal, with value at 51.2.
30 days Simple Moving Average is at 6497.3, showing Buy signal, Bitcoin is trading below it at $6601.36. 10 days Simple Moving Average is indicating Buy since Bitcoin is trading at $6601.36, below MAs value of 6602.1. 20 days Simple Moving Average is indicating Buy since Bitcoin is trading at $6601.36, below MAs value of 6558.9.
9 days Ichimoku Cloud Base Line is indicating Sell action with value at 6470.5, Bitcoin is trading below it at $6601.36. 100 days Simple Moving Average is indicating Sell since Bitcoin is trading at $6601.36, below MAs value of 6778.1. 100 days Exponential Moving Average is indicating Sell since Bitcoin is trading at $6601.36, below MAs value of 6849.2.
50 days Exponential Moving Average is at 6638.9, showing Sell signal, Bitcoin is trading below it at $6601.36. 200 days Simple Moving Average is indicating Sell since Bitcoin is trading at $6601.36, below MAs value of 7291.7. 200 days Exponential Moving Average is indicating Sell since Bitcoin is trading at $6601.36, below MAs value of 7264.8.
20 days Volume Weighted Moving Average is indicating Buy action with value at 6552.9, Bitcoin is trading below it at $6601.36. 50 days Simple Moving Average is at 6618.6, showing Sell signal, Bitcoin is trading below it at $6601.36. 9 days Hull Moving Average is at 6594.1, showing Buy signal, Bitcoin is trading below it at $6601.36.
Also Read About Bitcoin Mining Pools
20 days Exponential Moving Average is indicating Buy action with value at 6579.4, Bitcoin is trading below it at $6601.36. 30 days Exponential Moving Average is indicating Buy since Bitcoin is trading at $6601.36, below MAs value of 6590.2. 10 days Exponential Moving Average is indicating Buy since Bitcoin is trading at $6601.36, below MAs value of 6587.4.
Other Technical Price Analysis for today:
Litecoin (LTC) Moves Towards $64 Mark - Litcoin Price Analysis - 6 Oct 2018

