


Ethereum (ETH) Price Predictions / Ethereum (ETH) Forecast
| After | Price | Change |
|---|---|---|
| 1 day | $229.3616 | 0.52% |
| 1 week | $232.3134 | 1.82% |
| 1 month | $232.8733 | 2.06% |
| 6 months | $328.5273 | 43.98% |
| 1 year | $486.2430 | 113.11% |
| 5 years | $1,643.7524 | 620.41% |
We've applied Technical Analysis to the price of Ethereum (ETH/USD) for today and predict where price is headed.
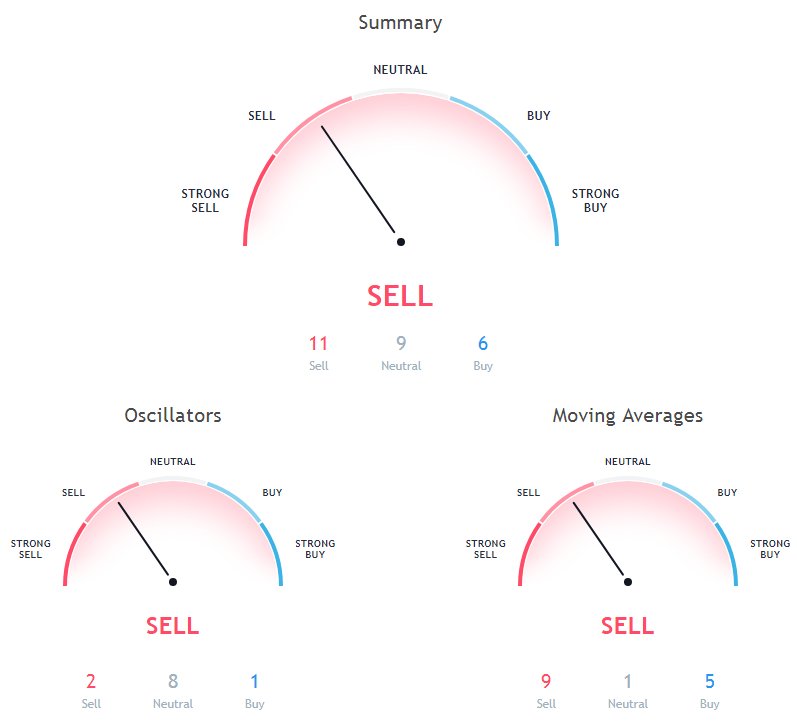
The Commodity Channel Index (CCI) is a momentum-based technical trading tool used to determine when a market is overbought or oversold. Commodity Channel Index is at 32.01, indicating Neutral action.
The Relative Strength Index (RSI) is an important indicator for measuring the speed and variation of price movements. Its value ranges from zero and 100. The value around 30 and below is considered an oversold region and over 70 as oversold regions. Relative Strength Index is indicating Neutral action, with value at 47.75.
The Stochastic Oscillator is a range bound momentum oscillator. Stochastic oscillator is at 60.44, indicating Neutral action.
9 days Hull Moving Average is indicating Sell since Ethereum is trading at $228.17, below MAs value of 233.23. 50 days Simple Moving Average is at 247.91, showing Sell signal, Ethereum is trading below it at $228.17. 10 days Exponential Moving Average is indicating Buy action with value at 227.94, Ethereum is trading below it at $228.17.
100 days Simple Moving Average is indicating Sell action with value at 341.7, Ethereum is trading below it at $228.17. 20 days Volume Weighted Moving Average is indicating Buy since Ethereum is trading at $228.17, below MAs value of 219.84. 20 days Simple Moving Average is indicating Buy action with value at 223.55, Ethereum is trading below it at $228.17.
20 days Exponential Moving Average is indicating Sell action with value at 228.91, Ethereum is trading below it at $228.17. 200 days Exponential Moving Average is at 420.69, showing Sell signal, Ethereum is trading below it at $228.17. 10 days Simple Moving Average is at 228.17, showing Buy signal, Ethereum is trading below it at $228.17.
Also Read: Ethereum Mining Pools
100 days Exponential Moving Average is indicating Sell since Ethereum is trading at $228.17, below MAs value of 332.99. 30 days Simple Moving Average is indicating Buy since Ethereum is trading at $228.17, below MAs value of 222.57. 50 days Exponential Moving Average is indicating Sell since Ethereum is trading at $228.17, below MAs value of 262.38.
200 days Simple Moving Average is at 455.67, showing Sell signal, Ethereum is trading below it at $228.17. 9 days Ichimoku Cloud Base Line is indicating Neutral action with value at 211.16, Ethereum is trading below it at $228.17. 30 days Exponential Moving Average is indicating Sell action with value at 236.68, Ethereum is trading below it at $228.17.
Other Technical Price Analysis for today:
Litecoin (LTC/USD) Price Prediction via Technical Analysis for 02 October 2018
Ripple (XRP/USD) Price Prediction via Technical Analysis for 02 October 2018
Bitcoin (BTC/USD) Price Prediction via Technical Analysis for 02 October 2018

