


Technical analysis is used by traders to analyze price movements of the cryptocurrency to form a trade with better risk-reward, entry and exists.
Ripple (XRP) Price Predictions / Ripple (XRP) Forecast
| After | Price | Change |
|---|---|---|
| 1 day | $0.5688 | 0.70% |
| 1 week | $0.5684 | 0.61% |
| 1 month | $0.5888 | 4.23% |
| 6 months | $0.6791 | 20.22% |
| 1 year | $1.0399 | 84.08% |
| 5 years | $2.4152 | 327.54% |
We've applied Technical Analysis to the price of Ripple (XRP/USD) for today and predict where price is headed.
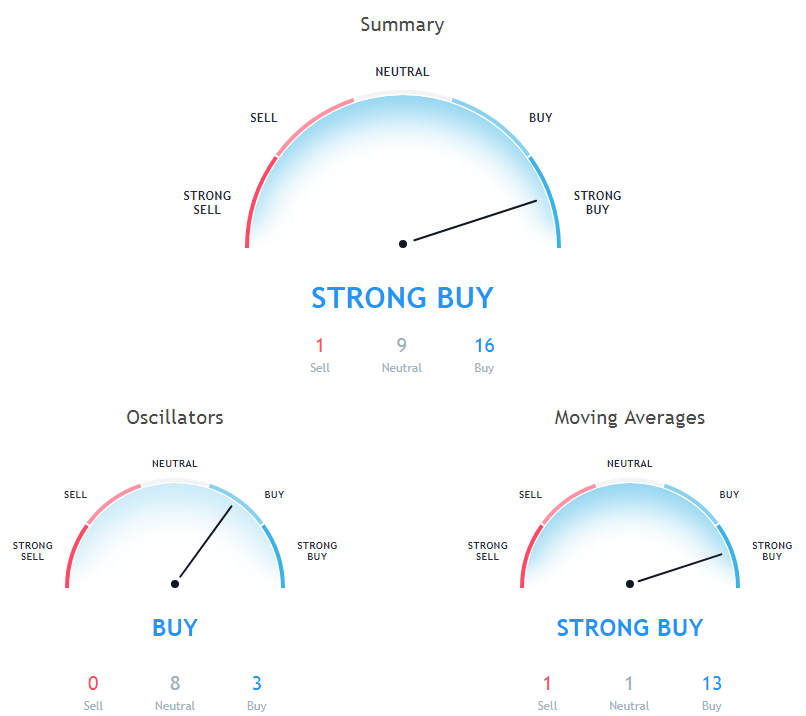
The Commodity Channel Index (CCI) is a momentum-based technical trading tool used to determine when a market is overbought or oversold. Commodity Channel Index is at 62.99727, indicating Neutral action.
The Stochastic Oscillator is a range bound momentum oscillator. Stochastic oscillator is at 57.3519, indicating Neutral action.
Relative Strength Index (RSI) is an important indicator that measures speed and change of price movements. Its value ranges between zero and 100. Value around 30 and below is considered oversold region and around 70 and above considered overbought regions. Relative Strength Index is at 68.20832, indicating Neutral action.
Moving averages come in many forms, but their use remains the same: to help traders identify the trends of assets by smoothing out the day-to-day price fluctuations.
30 days Simple Moving Average is at 0.39955, showing Buy signal, Ripple is trading below it at $0.5649. 100 days Simple Moving Average is at 0.40474, showing Buy signal, Ripple is trading below it at $0.5649. 10 days Simple Moving Average is at 0.54787, showing Buy signal, Ripple is trading below it at $0.5649.
10 days Exponential Moving Average is indicating Buy action with value at 0.53713, Ripple is trading below it at $0.5649. 50 days Exponential Moving Average is indicating Buy action with value at 0.42083, Ripple is trading below it at $0.5649. 30 days Exponential Moving Average is indicating Buy since Ripple is trading at $0.5649, below MAs value of 0.44763.
20 days Simple Moving Average is indicating Buy since Ripple is trading at $0.5649, below MAs value of 0.45494. 100 days Exponential Moving Average is at 0.43995, showing Buy signal, Ripple is trading below it at $0.5649. 200 days Simple Moving Average is indicating Buy action with value at 0.53006, Ripple is trading below it at $0.5649.
Also Read: Best Hardware Wallets
20 days Volume Weighted Moving Average is indicating Buy action with value at 0.5132, Ripple is trading below it at $0.5649. 20 days Exponential Moving Average is indicating Buy since Ripple is trading at $0.5649, below MAs value of 0.48188. 50 days Simple Moving Average is indicating Buy since Ripple is trading at $0.5649, below MAs value of 0.37062.
9 days Hull Moving Average is at 0.58752, showing Sell signal, Ripple is trading below it at $0.5649. 9 days Ichimoku Cloud Base Line is indicating Neutral action with value at 0.52172, Ripple is trading below it at $0.5649. 200 days Exponential Moving Average is indicating Buy since Ripple is trading at $0.5649, below MAs value of 0.51111.
Other Technical Price Analysis for today:
Litecoin (LTC/USD) Price Prediction via Technical Analysis for 02 October 2018
Ethereum (ETH/USD) Price Prediction via Technical Analysis for 02 October 2018
Bitcoin (BTC/USD) Price Prediction via Technical Analysis for 02 October 2018

