


Technical analysis is used by traders to analyze price movements of the cryptocurrency to form a trade with better risk-reward, entry and exists.
Bitcoin Cash (BCH) Price Predictions / Bitcoin Cash (BCH) Forecast
| After | Price | Change |
|---|---|---|
| 1 day | $437.6209 | 0.88% |
| 1 week | $438.2949 | 1.03% |
| 1 month | $464.8828 | 7.16% |
| 6 months | $648.6926 | 49.53% |
| 1 year | $1,062.4911 | 144.92% |
| 5 years | $3,451.8831 | 695.69% |
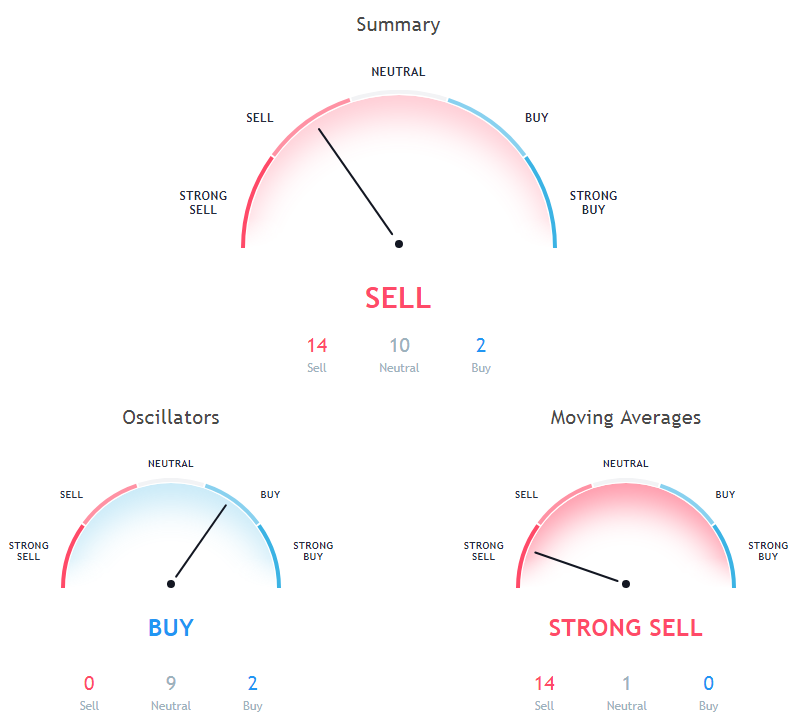
We've applied Technical Analysis to the price of Bitcoin Cash (BCH/USD) for today and predict where price is headed.
The Stochastic Oscillator is a range bound momentum oscillator. Stochastic oscillator is at 51.3, indicating Neutral action.
Relative Strength Index (RSI) is an important indicator that measures speed and change of price movements. Its value ranges between zero and 100. Value around 30 and below is considered oversold region and around 70 and above considered overbought regions. Relative Strength Index is indicating Neutral action, with value at 40.1.
The Commodity Channel Index (CCI) is a momentum oscillator used in technical analysis to measure an instrument's deviation from its statistical average. Commodity Channel Index is showing Neutral signal, with value at -80.7.
Moving Average (MA) is just average of any subset of numbers. For example, to calculate a basic 10-day moving average you would add up the closing prices from the past 10 days and then divide the result by 10.
30 days Exponential Moving Average is at 495.2, showing Sell signal, Bitcoin Cash is trading below it at $433.82. 9 days Ichimoku Cloud Base Line is at 534.3, showing Neutral signal, Bitcoin Cash is trading below it at $433.82. 9 days Hull Moving Average is indicating Sell action with value at 475.4, Bitcoin Cash is trading below it at $433.82.
200 days Simple Moving Average is indicating Sell since Bitcoin Cash is trading at $433.82, below MAs value of 852.6. 200 days Exponential Moving Average is indicating Sell since Bitcoin Cash is trading at $433.82, below MAs value of 790.1. 20 days Exponential Moving Average is indicating Sell since Bitcoin Cash is trading at $433.82, below MAs value of 475.8.
100 days Simple Moving Average is at 644.5, showing Sell signal, Bitcoin Cash is trading below it at $433.82. 20 days Simple Moving Average is indicating Sell since Bitcoin Cash is trading at $433.82, below MAs value of 461.5. 10 days Simple Moving Average is indicating Sell since Bitcoin Cash is trading at $433.82, below MAs value of 456.1.
Also Read: How to Trade in Zebpay?
10 days Exponential Moving Average is at 462.2, showing Sell signal, Bitcoin Cash is trading below it at $433.82. 50 days Simple Moving Average is at 521.6, showing Sell signal, Bitcoin Cash is trading below it at $433.82. 20 days Volume Weighted Moving Average is indicating Sell action with value at 463.1, Bitcoin Cash is trading below it at $433.82.
30 days Simple Moving Average is indicating Sell action with value at 501.1, Bitcoin Cash is trading below it at $433.82. 50 days Exponential Moving Average is at 539.8, showing Sell signal, Bitcoin Cash is trading below it at $433.82. 100 days Exponential Moving Average is at 653.8, showing Sell signal, Bitcoin Cash is trading below it at $433.82.
Other Technical Price Analysis for today:
Bitcoin (BTC/USD) Price Prediction via Technical Analysis for 25 September 2018
Ethereum (ETH/USD) Price Prediction via Technical Analysis for 25 September 2018
Stellar (XLM/USD) Price Prediction via Technical Analysis for 25 September 2018

