


Bitcoin (BTC) Price Predictions / Bitcoin (BTC) Forecast
| After | Price | Change |
|---|---|---|
| 1 day | $6,444.6336 | 0.72% |
| 1 week | $6,514.3799 | 1.81% |
| 1 month | $6,592.1563 | 3.02% |
| 6 months | $7,148.4140 | 11.71% |
| 1 year | $9,517.8081 | 48.74% |
| 5 years | $24,020.8165 | 275.39% |
We've applied Technical Analysis to the price of Bitcoin (BTC/USD) for today and predict where price is headed.
The Commodity Channel Index (CCI) is a momentum oscillator used in technical analysis to measure an instrument's deviation from its statistical average. Commodity Channel Index is at -21.6, indicating Neutral action.
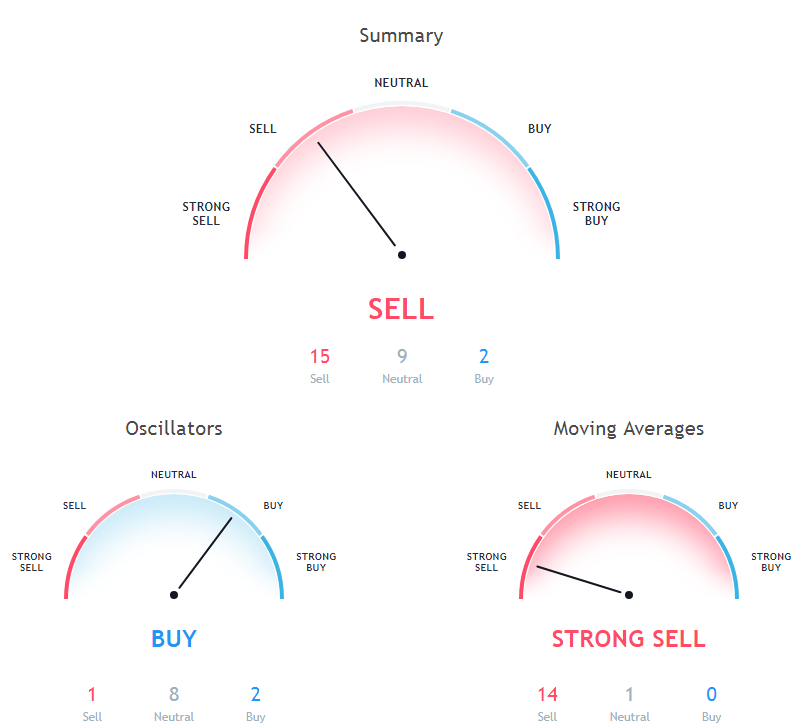
The Stochastic Oscillator is a range bound momentum oscillator. Stochastic oscillator is at 62.9, indicating Neutral action.
The Relative Strength Index (RSI) is an important indicator for measuring the speed and variation of price movements. Its value ranges from zero and 100. The value around 30 and below is considered an oversold region and over 70 as oversold regions. Relative Strength Index is indicating Neutral action, with value at 44.3.
200 days Simple Moving Average is indicating Sell since Bitcoin is trading at $6398.87, below MAs value of 7403. 20 days Simple Moving Average is indicating Sell action with value at 6445.6, Bitcoin is trading below it at $6398.87. 200 days Exponential Moving Average is at 7343, showing Sell signal, Bitcoin is trading below it at $6398.87.
50 days Exponential Moving Average is indicating Sell action with value at 6664.4, Bitcoin is trading below it at $6398.87. 10 days Simple Moving Average is at 6515.4, showing Sell signal, Bitcoin is trading below it at $6398.87. 50 days Simple Moving Average is indicating Sell since Bitcoin is trading at $6398.87, below MAs value of 6564.8.
20 days Volume Weighted Moving Average is indicating Sell action with value at 6454.9, Bitcoin is trading below it at $6398.87. 30 days Simple Moving Average is indicating Sell since Bitcoin is trading at $6398.87, below MAs value of 6659. 100 days Simple Moving Average is indicating Sell action with value at 6748.5, Bitcoin is trading below it at $6398.87.
Also Read: How to Buy Bitcoins using Paypal?
30 days Exponential Moving Average is at 6587.7, showing Sell signal, Bitcoin is trading below it at $6398.87. 100 days Exponential Moving Average is at 6912.3, showing Sell signal, Bitcoin is trading below it at $6398.87. 9 days Ichimoku Cloud Base Line is at 6764.6, showing Neutral signal, Bitcoin is trading below it at $6398.87.
10 days Exponential Moving Average is indicating Sell since Bitcoin is trading at $6398.87, below MAs value of 6540.1. 20 days Exponential Moving Average is indicating Sell action with value at 6553.1, Bitcoin is trading below it at $6398.87. 9 days Hull Moving Average is indicating Sell since Bitcoin is trading at $6398.87, below MAs value of 6653.6.
Other Technical Price Analysis for today:
Ethereum (ETH/USD) Price Prediction via Technical Analysis for 25 September 2018
Bitcoin Cash (BCH/USD) Price Prediction via Technical Analysis for 25 September 2018
Stellar (XLM/USD) Price Prediction via Technical Analysis for 25 September 2018

