


Trading Cryptocurrencies with the help of Technical Analysis can be very powerful and rewarding. History shows that if you cut your losses short and let your winners run, you'll make fortune from trading, and Technical Analysis helps you do just that. It allow you to Identify market direction, Trend and Stop Loss.
Bitcoin Cash (BCH) Price Predictions / Bitcoin Cash (BCH) Forecast
| After | Price | Change |
|---|---|---|
| 1 day | $418.5164 | 0.59% |
| 1 week | $422.4085 | 1.52% |
| 1 month | $444.5534 | 6.85% |
| 6 months | $619.4373 | 48.88% |
| 1 year | $1,043.6860 | 150.84% |
| 5 years | $3,440.7501 | 726.96% |
We've applied Technical Analysis to the price of Bitcoin Cash (BCH/USD) for today and predict where price is headed.
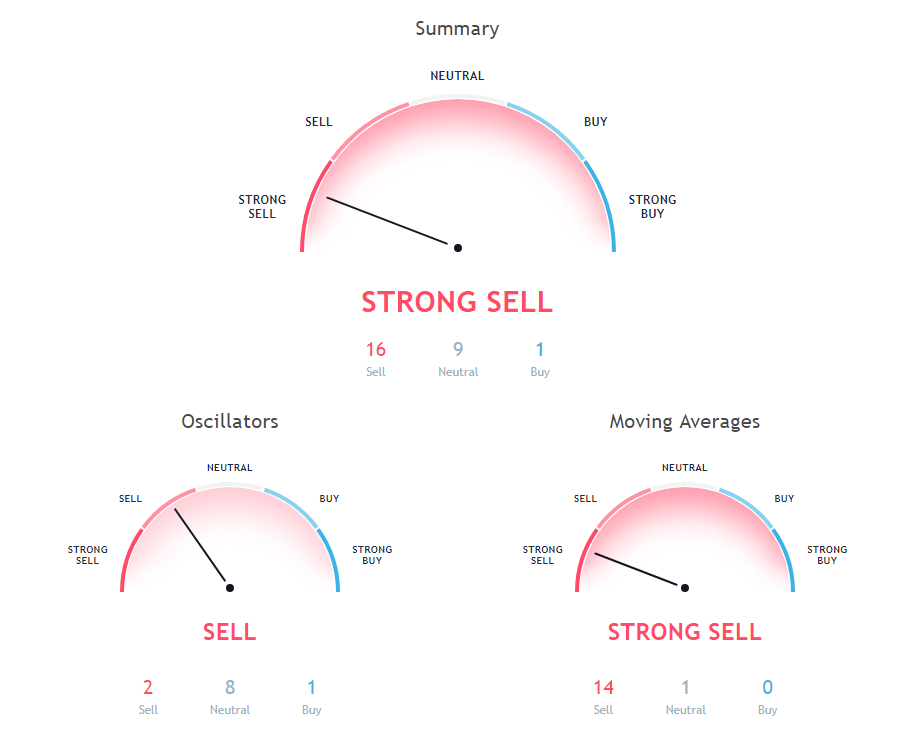
The stochastic oscillator is a momentum indicator that compares the closing price of a security with the price range over a specific period. Stochastic oscillator is indicating Neutral action, with value at 4.4.
The Relative Strength Index (RSI) is an important indicator for measuring the speed and variation of price movements. Its value ranges from zero and 100. The value around 30 and below is considered an oversold region and over 70 as oversold regions. Relative Strength Index is at 30.6, indicating Neutral action.
The Commodity Channel Index (CCI) is a momentum-based technical trading tool used to determine when a market is overbought or oversold. Commodity Channel Index is showing Neutral signal, with value at -168.5.
100 days Simple Moving Average is indicating Sell since Bitcoin Cash is trading at $416.07, below MAs value of 711.7. 20 days Simple Moving Average is indicating Sell action with value at 534.5, Bitcoin Cash is trading below it at $416.07. 10 days Exponential Moving Average is indicating Sell action with value at 488.3, Bitcoin Cash is trading below it at $416.07.
9 days Ichimoku Cloud Base Line is at 535.4, showing Neutral signal, Bitcoin Cash is trading below it at $416.07. 50 days Simple Moving Average is indicating Sell since Bitcoin Cash is trading at $416.07, below MAs value of 603.3. 20 days Volume Weighted Moving Average is at 546.5, showing Sell signal, Bitcoin Cash is trading below it at $416.07.
100 days Exponential Moving Average is indicating Sell action with value at 712.3, Bitcoin Cash is trading below it at $416.07. 200 days Exponential Moving Average is indicating Sell since Bitcoin Cash is trading at $416.07, below MAs value of 836.3. 20 days Exponential Moving Average is at 521.5, showing Sell signal, Bitcoin Cash is trading below it at $416.07.
10 days Simple Moving Average is at 507.5, showing Sell signal, Bitcoin Cash is trading below it at $416.07. 30 days Exponential Moving Average is at 546.5, showing Sell signal, Bitcoin Cash is trading below it at $416.07. 200 days Simple Moving Average is indicating Sell action with value at 900.9, Bitcoin Cash is trading below it at $416.07.
Also Read: Future of Cryptocurrencies
30 days Simple Moving Average is indicating Sell since Bitcoin Cash is trading at $416.07, below MAs value of 535.1. 50 days Exponential Moving Average is indicating Sell since Bitcoin Cash is trading at $416.07, below MAs value of 595.9. 9 days Hull Moving Average is indicating Sell action with value at 423.9, Bitcoin Cash is trading below it at $416.07.
Other Technical Price Analysis for today:
Augur (REP/USD) Price Prediction via Technical Analysis for 12 September 2018

