


Bitcoin (BTC) Price Predictions / Bitcoin (BTC) Forecast
| After | Price | Change |
|---|---|---|
| 1 day | $7,186.0733 | 0.77% |
| 1 week | $7,238.9950 | 1.51% |
| 1 month | $7,147.1996 | 0.22% |
| 6 months | $7,808.6370 | 9.50% |
| 1 year | $10,266.0533 | 43.96% |
| 5 years | $24,411.8525 | 242.33% |
We've applied Technical Analysis to the price of Bitcoin (BTC/USD) for today and predict where price is headed.
The Commodity Channel Index (CCI) is a momentum oscillator used in technical analysis to measure an instrument's deviation from its statistical average. Commodity Channel Index is showing Sell signal, with value at 176.8.
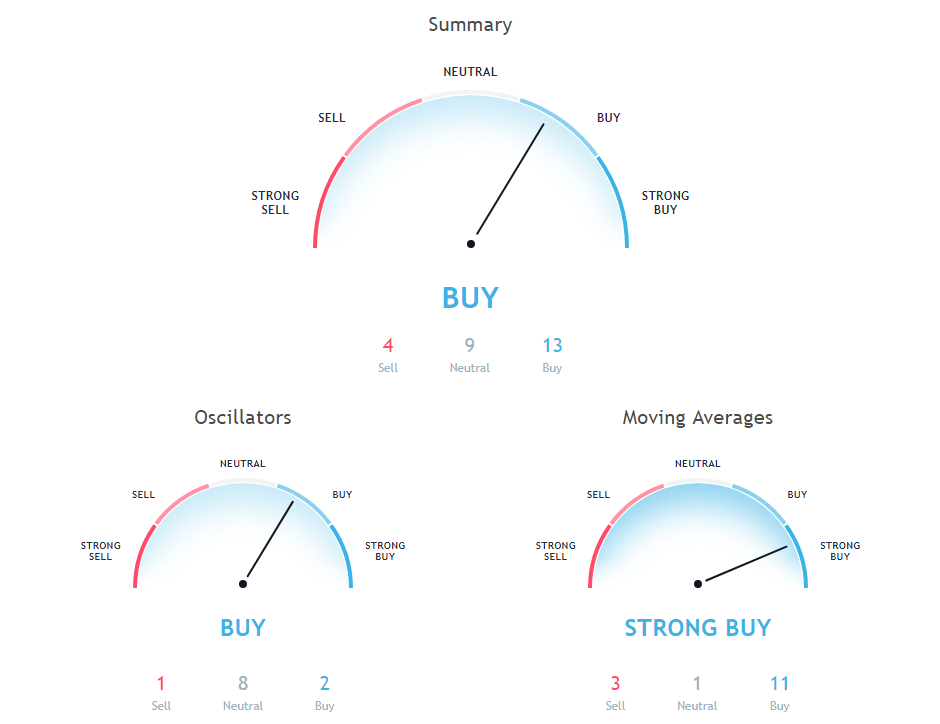
The Stochastic Oscillator is a range bound momentum oscillator. Stochastic oscillator is indicating Neutral action, with value at 96.7.
Relative Strength Index (RSI) is an important indicator that measures speed and change of price movements. Its value ranges between zero and 100. Value around 30 and below is considered oversold region and around 70 and above considered overbought regions. Relative Strength Index is showing Neutral signal, with value at 59.9.
10 days Exponential Moving Average is at 6783.2, showing Buy signal, Bitcoin is trading below it at $7131.18. 20 days Simple Moving Average is at 6502.6, showing Buy signal, Bitcoin is trading below it at $7131.18. 50 days Exponential Moving Average is at 6841.9, showing Buy signal, Bitcoin is trading below it at $7131.18.
200 days Exponential Moving Average is indicating Sell action with value at 7571.9, Bitcoin is trading below it at $7131.18. 30 days Exponential Moving Average is indicating Buy since Bitcoin is trading at $7131.18, below MAs value of 6756.7. 9 days Hull Moving Average is indicating Buy action with value at 7110.2, Bitcoin is trading below it at $7131.18.
9 days Ichimoku Cloud Base Line is indicating Neutral action with value at 6675.4, Bitcoin is trading below it at $7131.18. 100 days Simple Moving Average is indicating Buy action with value at 6916.4, Bitcoin is trading below it at $7131.18. 30 days Simple Moving Average is indicating Buy action with value at 6695.2, Bitcoin is trading below it at $7131.18.
20 days Exponential Moving Average is at 6723.3, showing Buy signal, Bitcoin is trading below it at $7131.18. 200 days Simple Moving Average is indicating Sell action with value at 7886, Bitcoin is trading below it at $7131.18. 10 days Simple Moving Average is indicating Buy since Bitcoin is trading at $7131.18, below MAs value of 6687.1.
Also Read: Best Bitcoin Cloud Mining Platforms of 2018
50 days Simple Moving Average is indicating Buy since Bitcoin is trading at $7131.18, below MAs value of 6967.8. 100 days Exponential Moving Average is indicating Sell action with value at 7141.1, Bitcoin is trading below it at $7131.18. 20 days Volume Weighted Moving Average is indicating Buy action with value at 6421.1, Bitcoin is trading below it at $7131.18.
Other Technical Price Analysis for today:
Bitcoin Cash (BCH/USD) Price Prediction via Technical Analysis for 29 August 2018
EOS (EOS/USD) Price Prediction via Technical Analysis for 29 August 2018
Tron (TRX/USD) Price Prediction via Technical Analysis for 29 August 2018

