


Bitcoin (BTC) Price Predictions / Bitcoin (BTC) Forecast
| After | Price | Change |
|---|---|---|
| 1 day | $6,533.5903 | 0.68% |
| 1 week | $6,594.3525 | 1.62% |
| 1 month | $6,457.2001 | -0.49% |
| 6 months | $7,014.5705 | 8.10% |
| 1 year | $9,376.7932 | 44.50% |
| 5 years | $23,890.0831 | 268.15% |
We've applied Technical Analysis to the price of Bitcoin (BTC/USD) for today and predict where price is headed.
The stochastic oscillator is a momentum indicator that compares the closing price of a security with the price range over a specific period. Stochastic oscillator is indicating Neutral action, with value at 55.1.
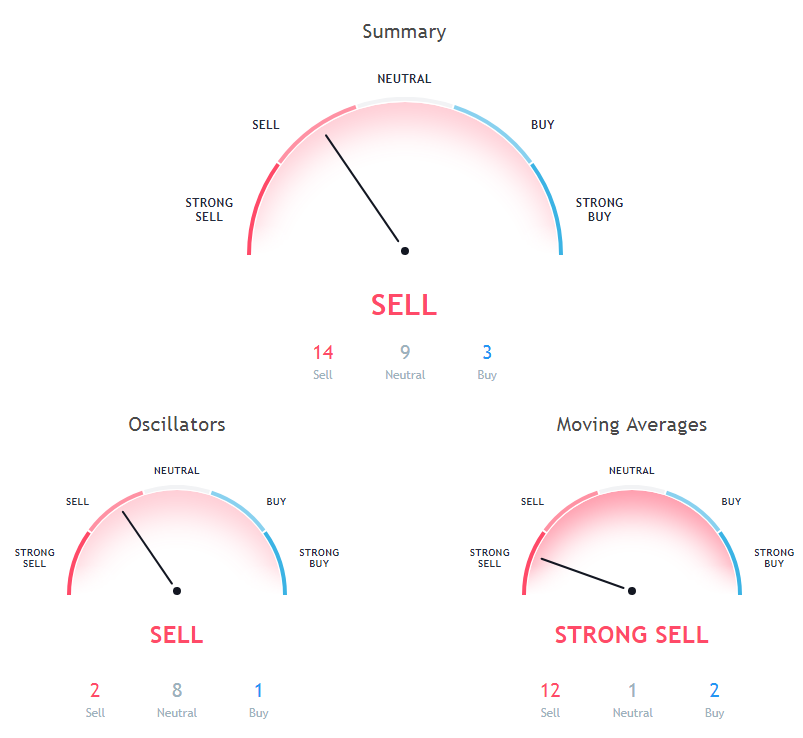
Relative Strength Index (RSI) is an important indicator that measures speed and change of price movements. Its value ranges between zero and 100. Value around 30 and below is considered oversold region and around 70 and above considered overbought regions. Relative Strength Index is indicating Neutral action, with value at 47.3.
The Commodity Channel Index (CCI) is a momentum oscillator used in technical analysis to measure an instrument's deviation from its statistical average. Commodity Channel Index is showing Neutral signal, with value at 25.6.
Moving Average (MA) in simple term is just average of any subset of numbers. For example, 50 Days simple moving average is calculated at any point in chart by summing past 50 days of price and then dividing it by 50.
100 days Exponential Moving Average is indicating Sell since Bitcoin is trading at $6489.17, below MAs value of 6904.8. 9 days Ichimoku Cloud Base Line is indicating Neutral action with value at 6764.6, Bitcoin is trading below it at $6489.17. 200 days Exponential Moving Average is at 7334.9, showing Sell signal, Bitcoin is trading below it at $6489.17.
10 days Simple Moving Average is indicating Sell action with value at 6519.1, Bitcoin is trading below it at $6489.17. 20 days Simple Moving Average is indicating Buy since Bitcoin is trading at $6489.17, below MAs value of 6446.6. 50 days Exponential Moving Average is indicating Sell action with value at 6659.3, Bitcoin is trading below it at $6489.17.
20 days Volume Weighted Moving Average is indicating Buy since Bitcoin is trading at $6489.17, below MAs value of 6447.2. 10 days Exponential Moving Average is indicating Sell since Bitcoin is trading at $6489.17, below MAs value of 6538. 9 days Hull Moving Average is indicating Sell action with value at 6545, Bitcoin is trading below it at $6489.17.
Also Read: Future of Cryptocurrencies
200 days Simple Moving Average is indicating Sell since Bitcoin is trading at $6489.17, below MAs value of 7391.8. 50 days Simple Moving Average is indicating Sell since Bitcoin is trading at $6489.17, below MAs value of 6561.2. 30 days Simple Moving Average is indicating Sell action with value at 6646.5, Bitcoin is trading below it at $6489.17.
100 days Simple Moving Average is at 6746.7, showing Sell signal, Bitcoin is trading below it at $6489.17. 30 days Exponential Moving Average is at 6584.2, showing Sell signal, Bitcoin is trading below it at $6489.17. 20 days Exponential Moving Average is at 6551.1, showing Sell signal, Bitcoin is trading below it at $6489.17.
Other Technical Price Analysis for today:
Ripple (XRP/USD) Price Prediction via Technical Analysis for 26 September 2018
Stellar (XLM/USD) Price Prediction via Technical Analysis for 26 September 2018
EOS (EOS/USD) Price Prediction via Technical Analysis for 26 September 2018

