


Bitcoin (BTC) Price Predictions / Bitcoin (BTC) Forecast
| After | Price | Change |
|---|---|---|
| 1 day | $6,588.9822 | 0.09% |
| 1 week | $6,701.3490 | 1.80% |
| 1 month | $6,659.5273 | 1.16% |
| 6 months | $7,225.1797 | 9.75% |
| 1 year | $9,550.1015 | 45.07% |
| 5 years | $24,125.4334 | 266.48% |
We've applied Technical Analysis to the price of Bitcoin (BTC/USD) for today and predict where price is headed.
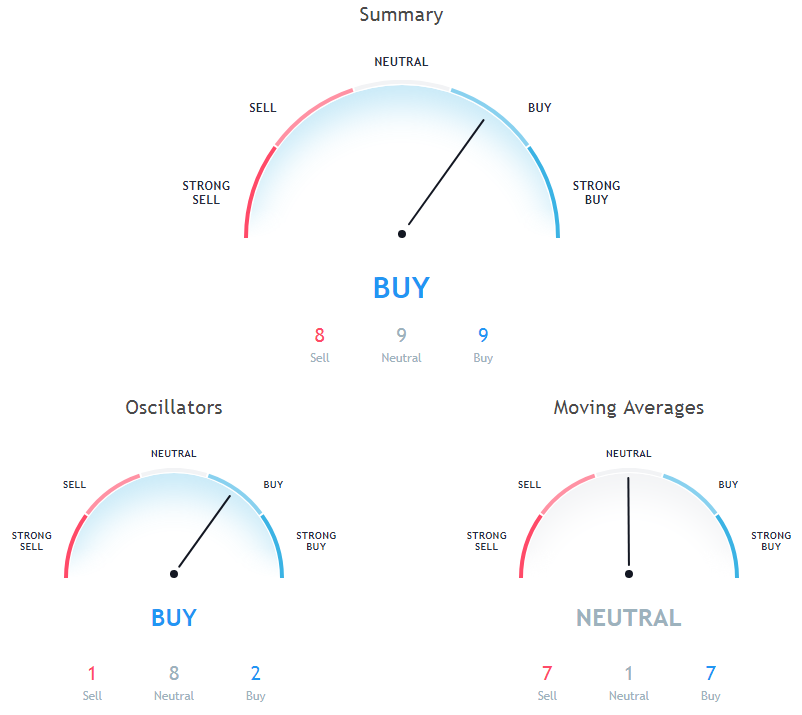
The Commodity Channel Index (CCI) is a momentum oscillator used in technical analysis to measure an instrument's deviation from its statistical average. Commodity Channel Index is indicating Neutral action, with value at 31.2.
The Relative Strength Index (RSI) is an important indicator for measuring the speed and variation of price movements. Its value ranges from zero and 100. The value around 30 and below is considered an oversold region and over 70 as oversold regions. Relative Strength Index is at 49.9, indicating Neutral action.
The Stochastic Oscillator is a range bound momentum oscillator. Stochastic oscillator is showing Neutral signal, with value at 67.6.
20 days Volume Weighted Moving Average is indicating Buy since Bitcoin is trading at $6583.08, below MAs value of 6530. 100 days Simple Moving Average is indicating Sell since Bitcoin is trading at $6583.08, below MAs value of 6753.6. 20 days Simple Moving Average is at 6530, showing Buy signal, Bitcoin is trading below it at $6583.08.
20 days Exponential Moving Average is indicating Buy action with value at 6576.9, Bitcoin is trading below it at $6583.08. 30 days Exponential Moving Average is indicating Sell action with value at 6593.6, Bitcoin is trading below it at $6583.08. 200 days Simple Moving Average is at 7336.2, showing Sell signal, Bitcoin is trading below it at $6583.08.
50 days Simple Moving Average is indicating Sell action with value at 6592.9, Bitcoin is trading below it at $6583.08. 10 days Simple Moving Average is indicating Sell since Bitcoin is trading at $6583.08, below MAs value of 6605.3. 30 days Simple Moving Average is at 6572.5, showing Buy signal, Bitcoin is trading below it at $6583.08.
9 days Hull Moving Average is indicating Sell action with value at 6627.3, Bitcoin is trading below it at $6583.08. 10 days Exponential Moving Average is indicating Sell since Bitcoin is trading at $6583.08, below MAs value of 6585.9. 50 days Exponential Moving Average is indicating Sell since Bitcoin is trading at $6583.08, below MAs value of 6651.8.
Also Read: How to Buy Bitcoins using Cash?
200 days Exponential Moving Average is indicating Sell action with value at 7300, Bitcoin is trading below it at $6583.08. 100 days Exponential Moving Average is indicating Sell action with value at 6877.6, Bitcoin is trading below it at $6583.08. 9 days Ichimoku Cloud Base Line is at 6470.5, showing Neutral signal, Bitcoin is trading below it at $6583.08.
Other Technical Price Analysis for today:
Bitcoin Cash (BCH/USD) Price Prediction via Technical Analysis for 01 October 2018
Stellar (XLM/USD) Price Prediction via Technical Analysis for 01 October 2018

