


Tron (TRX) Price Predictions / Tron (TRX) Forecast
| After | Price | Change |
|---|---|---|
| 1 day | $0.0136 | 0.56% |
| 1 week | $0.0137 | 1.38% |
| 1 month | $0.0142 | 4.84% |
| 6 months | $0.0191 | 41.25% |
| 1 year | $0.0448 | 231.28% |
| 5 years | $0.1737 | 1,184.44% |
The Commodity Channel Index (CCI) is a momentum oscillator used in technical analysis to measure an instrument's deviation from its statistical average. Commodity Channel Index is at -28.252153, indicating Neutral action.
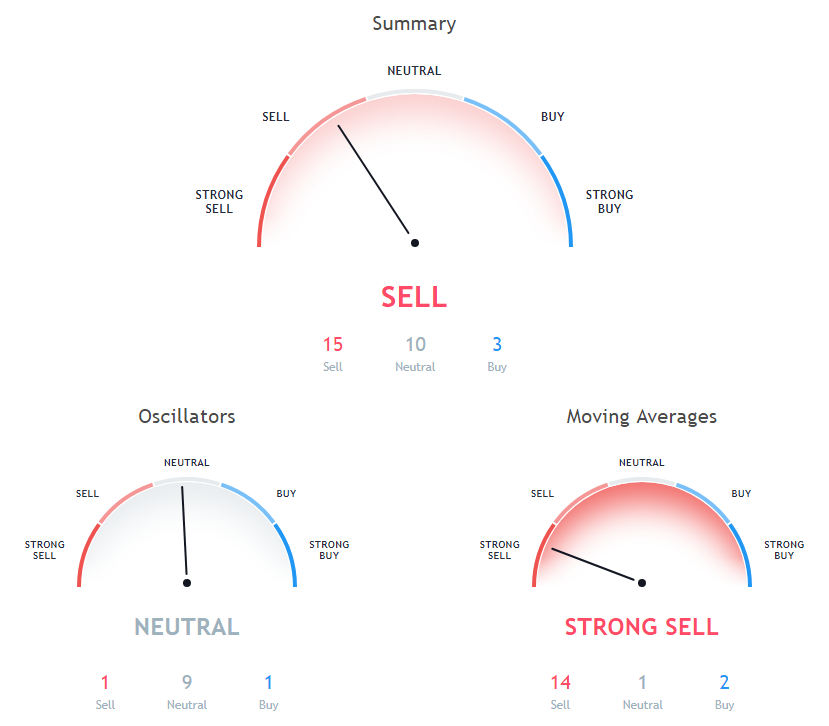
Relative Strength Index (RSI) is an important indicator that measures speed and change of price movements. Its value ranges between zero and 100. Value around 30 and below is considered oversold region and around 70 and above considered overbought regions. Relative Strength Index is at 38.349617, indicating Neutral action.
The Stochastic Oscillator is a range bound momentum oscillator. Stochastic oscillator is indicating Neutral action, with value at 40.38828.
50 days Simple Moving Average is indicating Sell action with value at 0.018755, Tron is trading below it at $0.01352. 100 days Simple Moving Average is indicating Sell since Tron is trading at $0.01352, below MAs value of 0.020611. 9 days Ichimoku Cloud Base Line is indicating Neutral since Tron is trading at $0.01352, below MAs value of 0.015575.
20 days Simple Moving Average is at 0.013829, showing Sell signal, Tron is trading below it at $0.01352. 200 days Simple Moving Average is indicating Sell action with value at 0.02931, Tron is trading below it at $0.01352. 100 days Exponential Moving Average is at 0.021198, showing Sell signal, Tron is trading below it at $0.01352.
10 days Exponential Moving Average is at 0.013845, showing Sell signal, Tron is trading below it at $0.01352. 9 days Hull Moving Average is indicating Buy since Tron is trading at $0.01352, below MAs value of 0.013397. 30 days Simple Moving Average is indicating Sell action with value at 0.015701, Tron is trading below it at $0.01352.
50 days Exponential Moving Average is indicating Sell action with value at 0.017568, Tron is trading below it at $0.01352. 10 days Simple Moving Average is at 0.01398, showing Sell signal, Tron is trading below it at $0.01352. 20 days Exponential Moving Average is indicating Sell since Tron is trading at $0.01352, below MAs value of 0.014718.
5 days Simple Moving Average is indicating Buy since Tron is trading at $0.01352, below MAs value of 0.013432. 200 days Exponential Moving Average is at 0.028485, showing Sell signal, Tron is trading below it at $0.01352. 30 days Exponential Moving Average is indicating Sell since Tron is trading at $0.01352, below MAs value of 0.01579.
Also Read: 5 Best Altcoin Exchanges and Trading Platforms of 2018
20 days Volume Weighted Moving Average is at 0.014012, showing Sell signal, Tron is trading below it at $0.01352. 5 days Exponential Moving Average is at 0.013623, showing Sell signal, Tron is trading below it at $0.01352.
Other Technical Price Analysis for today:
Factom (FCT) Price Cramps Down Slightly - Factom Price Analysis - 10 Dec 2018

