


Bitcoin (BTC) Price Predictions / Bitcoin (BTC) Forecast
| After | Price | Change |
|---|---|---|
| 1 day | $3,562.5604 | 0.60% |
| 1 week | $3,572.4240 | 0.88% |
| 1 month | $3,709.8295 | 4.76% |
| 6 months | $4,212.8533 | 18.97% |
| 1 year | $6,407.1233 | 80.93% |
| 5 years | $21,332.7087 | 502.41% |
The Commodity Channel Index (CCI) is a momentum-based technical trading tool used to determine when a market is overbought or oversold. Commodity Channel Index is indicating Neutral action, with value at -94.4.
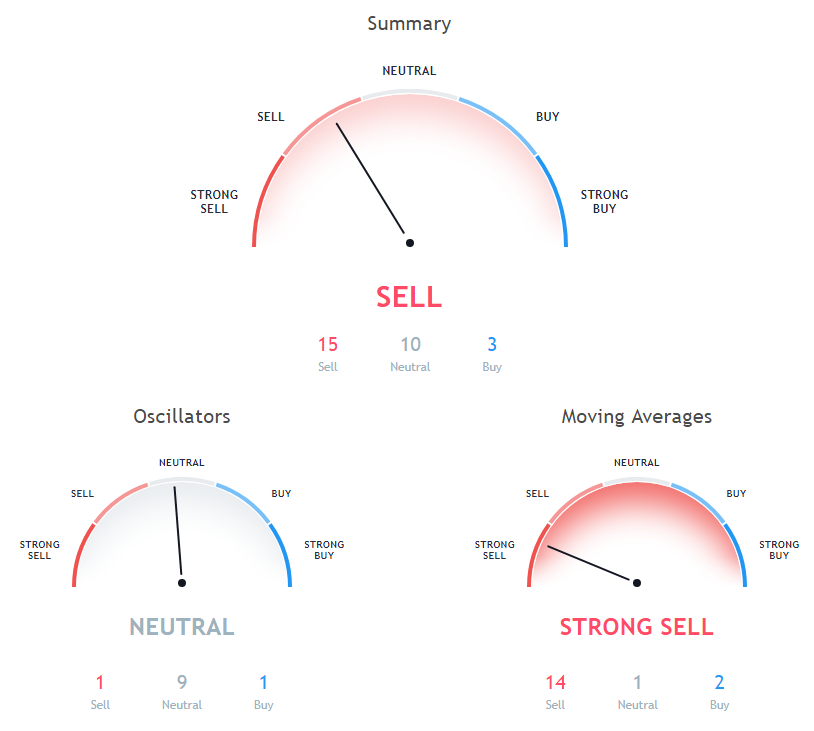
The Relative Strength Index (RSI) is an important indicator for measuring the speed and variation of price movements. Its value ranges from zero and 100. The value around 30 and below is considered an oversold region and over 70 as oversold regions. Relative Strength Index is indicating Neutral action, with value at 30.4.
The stochastic oscillator is a momentum indicator that compares the closing price of a security with the price range over a specific period. Stochastic oscillator is showing Neutral signal, with value at 25.
20 days Simple Moving Average is indicating Sell action with value at 3984.5, Bitcoin is trading below it at $3541.23. 30 days Simple Moving Average is indicating Sell since Bitcoin is trading at $3541.23, below MAs value of 4571.7. 30 days Exponential Moving Average is at 4461.2, showing Sell signal, Bitcoin is trading below it at $3541.23.
9 days Ichimoku Cloud Base Line is indicating Neutral action with value at 4608.8, Bitcoin is trading below it at $3541.23. 10 days Exponential Moving Average is indicating Sell since Bitcoin is trading at $3541.23, below MAs value of 3758.6. 200 days Exponential Moving Average is indicating Sell action with value at 6380.8, Bitcoin is trading below it at $3541.23.
50 days Exponential Moving Average is indicating Sell action with value at 4967.6, Bitcoin is trading below it at $3541.23. 200 days Simple Moving Average is indicating Sell action with value at 6423, Bitcoin is trading below it at $3541.23. 100 days Simple Moving Average is indicating Sell since Bitcoin is trading at $3541.23, below MAs value of 5949.
5 days Exponential Moving Average is indicating Sell action with value at 3622, Bitcoin is trading below it at $3541.23. 100 days Exponential Moving Average is at 5659.4, showing Sell signal, Bitcoin is trading below it at $3541.23. 5 days Simple Moving Average is indicating Buy action with value at 3546.5, Bitcoin is trading below it at $3541.23.
50 days Simple Moving Average is indicating Sell since Bitcoin is trading at $3541.23, below MAs value of 5330.4. 20 days Exponential Moving Average is at 4117.2, showing Sell signal, Bitcoin is trading below it at $3541.23. 9 days Hull Moving Average is indicating Buy action with value at 3461.3, Bitcoin is trading below it at $3541.23.
Also Read: Best Bitcoin Wallets
10 days Simple Moving Average is indicating Sell since Bitcoin is trading at $3541.23, below MAs value of 3780.3. 20 days Volume Weighted Moving Average is at 3978.6, showing Sell signal, Bitcoin is trading below it at $3541.23.
Other Technical Price Analysis for today:
Tron (TRX) Price May Consolidate Above $0.0120 Level - Tron Price Analysis - 10 Dec 2018
Factom (FCT) Price Cramps Down Slightly - Factom Price Analysis - 10 Dec 2018

