


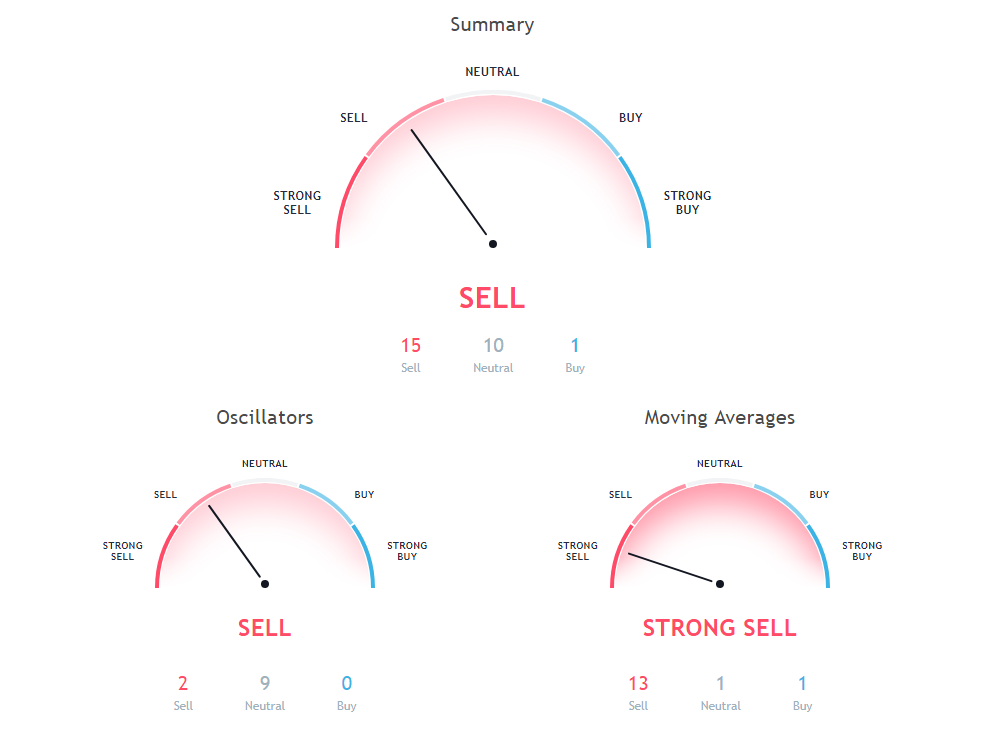
Commodity Channel Index is showing Neutral signal, with value at -73.83. Stochastic oscillator is showing Neutral signal, with value at 17.95. Relative Strength Index is showing Neutral signal, with value at 29.38.We've applied Technical Analysis to the price of NEO (NEO/USD) for today and predict where price is headed.
Also Read: Neo vs Ethereum: A Comparison of the Past, Present and Future
50 days Simple Moving Average is at 30.27, showing Sell signal. Current price $17.62 of NEO is below 50 days Simple Moving Average. 30 days Exponential Moving Average is at 25.07, showing Sell signal. Current price $17.62 of NEO is below 30 days Exponential Moving Average. 20 days Simple Moving Average is at 23.42, showing Sell signal. Current price $17.62 of NEO is below 20 days Simple Moving Average.
50 days Exponential Moving Average is at 29.56, showing Sell signal. Current price $17.62 of NEO is below 50 days Exponential Moving Average. 100 days Simple Moving Average is at 39.84, showing Sell signal. Current price $17.62 of NEO is below 100 days Simple Moving Average. 200 days Exponential Moving Average is at 48.01, showing Sell signal. Current price $17.62 of NEO is below 200 days Exponential Moving Average.
20 days Exponential Moving Average is at 22.34, showing Sell signal. Current price $17.62 of NEO is below 20 days Exponential Moving Average. 9 days Ichimoku Cloud Base Line is at 24.71, showing Neutral signal. Current price $17.62 of NEO is below 9 days Ichimoku Cloud Base Line. 200 days Simple Moving Average is at 63.7, showing Sell signal. Current price $17.62 of NEO is below 200 days Simple Moving Average.
30 days Simple Moving Average is at 26.85, showing Sell signal. Current price $17.62 of NEO is below 30 days Simple Moving Average. 10 days Exponential Moving Average is at 18.76, showing Sell signal. Current price $17.62 of NEO is below 10 days Exponential Moving Average. 20 days Volume Weighted Moving Average is at 20.35, showing Sell signal. Current price $17.62 of NEO is below 20 days Volume Weighted Moving Average.
Also Read: Beginner's Guide to Cryptocurrency and Blockchain
9 days Hull Moving Average is at 15.44, showing Buy signal. Current price $17.62 of NEO is below 9 days Hull Moving Average. 10 days Simple Moving Average is at 18.18, showing Sell signal. Current price $17.62 of NEO is below 10 days Simple Moving Average. 100 days Exponential Moving Average is at 39.51, showing Sell signal. Current price $17.62 of NEO is below 100 days Exponential Moving Average.
Other Technical Price Analysis for today:
Bitcoin (BTC/USD) Price Prediction via Technical Analysis for 17 August 2018
Ethereum (ETH/USD) Price Prediction via Technical Analysis for 17 August 2018
DigitalCash (DASH/USD) Price Prediction via Technical Analysis for 17 August 2018

