


Technical analysis is a sub-discipline of trading which is used to evaluate securities with various tools and identify trading opportunities.
Litecoin (LTC) Price Predictions / Litecoin (LTC) Forecast
| After | Price | Change |
|---|---|---|
| 1 day | $55.6661 | 0.26% |
| 1 week | $55.9040 | 0.69% |
| 1 month | $54.7935 | -1.31% |
| 6 months | $78.7653 | 41.87% |
| 1 year | $121.0650 | 118.06% |
| 5 years | $338.4265 | 509.56% |
We've applied Technical Analysis to the price of Litecoin (LTC/USD) for today and predict where price is headed.
The Relative Strength Index (RSI) is an important indicator for measuring the speed and variation of price movements. Its value ranges from zero and 100. The value around 30 and below is considered an oversold region and over 70 as oversold regions. Relative Strength Index is at 35.613, indicating Neutral action.
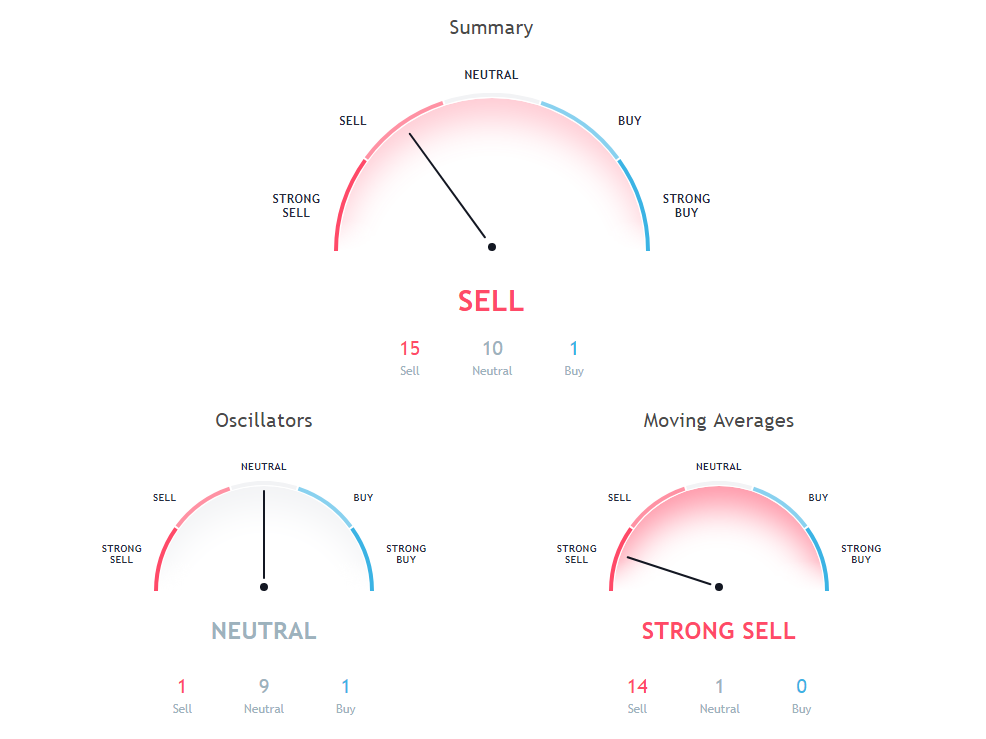
The Stochastic Oscillator is a range bound momentum oscillator. Stochastic oscillator is indicating Neutral action, with value at 27.294.
The Commodity Channel Index (CCI) is a momentum-based technical trading tool used to determine when a market is overbought or oversold. Commodity Channel Index is indicating Neutral action, with value at -69.122.
Moving Average (MA) is just average of any subset of numbers. For example, to calculate a basic 10-day moving average you would add up the closing prices from the past 10 days and then divide the result by 10.
200 days Exponential Moving Average is at 107.978, showing Sell signal, Litecoin is trading below it at $55.52. 100 days Exponential Moving Average is indicating Sell since Litecoin is trading at $55.52, below MAs value of 90.492. 10 days Simple Moving Average is at 56.531, showing Sell signal, Litecoin is trading below it at $55.52.
50 days Exponential Moving Average is at 73.781, showing Sell signal, Litecoin is trading below it at $55.52. 30 days Simple Moving Average is at 69.379, showing Sell signal, Litecoin is trading below it at $55.52. 10 days Exponential Moving Average is indicating Sell since Litecoin is trading at $55.52, below MAs value of 57.691.
9 days Hull Moving Average is at 55.865, showing Sell signal, Litecoin is trading below it at $55.52. 30 days Exponential Moving Average is indicating Sell since Litecoin is trading at $55.52, below MAs value of 66.428. 100 days Simple Moving Average is indicating Sell since Litecoin is trading at $55.52, below MAs value of 91.793.
Also Read: How to Trade Cryptocurrencies on Binance Exchange
20 days Volume Weighted Moving Average is indicating Sell since Litecoin is trading at $55.52, below MAs value of 60.181. 9 days Ichimoku Cloud Base Line is indicating Neutral action with value at 67.332, Litecoin is trading below it at $55.52. 200 days Simple Moving Average is indicating Sell since Litecoin is trading at $55.52, below MAs value of 126.67.
20 days Exponential Moving Average is indicating Sell action with value at 62.302, Litecoin is trading below it at $55.52. 20 days Simple Moving Average is at 62.467, showing Sell signal, Litecoin is trading below it at $55.52. 50 days Simple Moving Average is indicating Sell since Litecoin is trading at $55.52, below MAs value of 74.42.
Other Technical Price Analysis for today:
Bitcoin (BTC/USD) Price Prediction via Technical Analysis for 21 August 2018
Ethereum (ETH/USD) Price Prediction via Technical Analysis for 21 August 2018
Tron (TRX/USD) Price Prediction via Technical Analysis for 21 August 2018

