


Tron, a blockchain platform which is acquired by BitTorrent was recently reported to 5 employees have left the company following this acquisition.
Tron (TRX) Price Predictions / Tron (TRX) Forecast
| After | Price | Change |
|---|---|---|
| 1 day | $0.0211 | 0.60% |
| 1 week | $0.0210 | 0.18% |
| 1 month | $0.0211 | 0.68% |
| 6 months | $0.0309 | 47.33% |
| 1 year | $0.0558 | 166.29% |
| 5 years | $0.1974 | 841.76% |
We've applied Technical Analysis to the price of Tron (TRX/USD) for today and predict where price is headed.
The Relative Strength Index (RSI) is an important indicator for measuring the speed and variation of price movements. Its value ranges from zero and 100. The value around 30 and below is considered an oversold region and over 70 as oversold regions. Relative Strength Index is showing Neutral signal, with value at 37.378777.
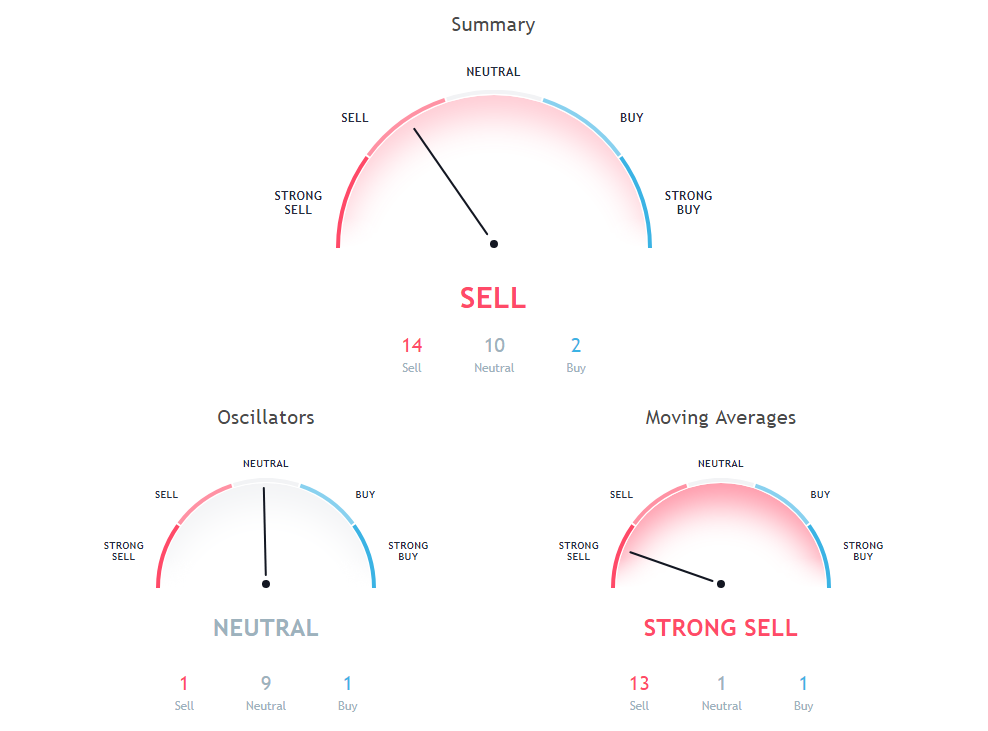
The stochastic oscillator is a momentum indicator that compares the closing price of a security with the price range over a specific period. Stochastic oscillator is showing Neutral signal, with value at 37.961895.
The Commodity Channel Index (CCI) is a momentum-based technical trading tool used to determine when a market is overbought or oversold. Commodity Channel Index is at -58.13733, indicating Neutral action.
200 days Simple Moving Average is at 0.04618, showing Sell signal, Tron is trading below it at $0.02096. 100 days Simple Moving Average is at 0.043238, showing Sell signal, Tron is trading below it at $0.02096. 20 days Exponential Moving Average is indicating Sell since Tron is trading at $0.02096, below MAs value of 0.024197.
50 days Simple Moving Average is indicating Sell action with value at 0.031314, Tron is trading below it at $0.02096. 30 days Exponential Moving Average is indicating Sell action with value at 0.026638, Tron is trading below it at $0.02096. 20 days Volume Weighted Moving Average is indicating Sell action with value at 0.023402, Tron is trading below it at $0.02096.
50 days Exponential Moving Average is indicating Sell since Tron is trading at $0.02096, below MAs value of 0.030983. 100 days Exponential Moving Average is at 0.037909, showing Sell signal, Tron is trading below it at $0.02096. 9 days Hull Moving Average is indicating Sell since Tron is trading at $0.02096, below MAs value of 0.021613.
9 days Ichimoku Cloud Base Line is indicating Neutral since Tron is trading at $0.02096, below MAs value of 0.028461. 10 days Simple Moving Average is at 0.020675, showing Buy signal, Tron is trading below it at $0.02096. 20 days Simple Moving Average is indicating Sell since Tron is trading at $0.02096, below MAs value of 0.023975.
Also Read: Cryptocurrency FAQs
200 days Exponential Moving Average is indicating Sell since Tron is trading at $0.02096, below MAs value of 0.045563. 30 days Simple Moving Average is at 0.028, showing Sell signal, Tron is trading below it at $0.02096. 10 days Exponential Moving Average is at 0.021706, showing Sell signal, Tron is trading below it at $0.02096.
Other Technical Price Analysis for today:
Bitcoin (BTC/USD) Price Prediction via Technical Analysis for 21 August 2018
Ethereum (ETH/USD) Price Prediction via Technical Analysis for 21 August 2018
Litecoin (LTC/USD) Price Prediction via Technical Analysis for 21 August 2018

