


Ethereum (ETH) Price Predictions / Ethereum (ETH) Forecast
| After | Price | Change |
|---|---|---|
| 1 day | $126.3051 | 0.58% |
| 1 week | $127.5675 | 1.58% |
| 1 month | $129.4336 | 3.07% |
| 6 months | $208.2977 | 65.87% |
| 1 year | $401.8769 | 220.02% |
| 5 years | $1,509.3667 | 1,101.92% |
The Commodity Channel Index (CCI) is a momentum-based technical trading tool used to determine when a market is overbought or oversold. Commodity Channel Index is indicating Buy action, with value at -139.2.
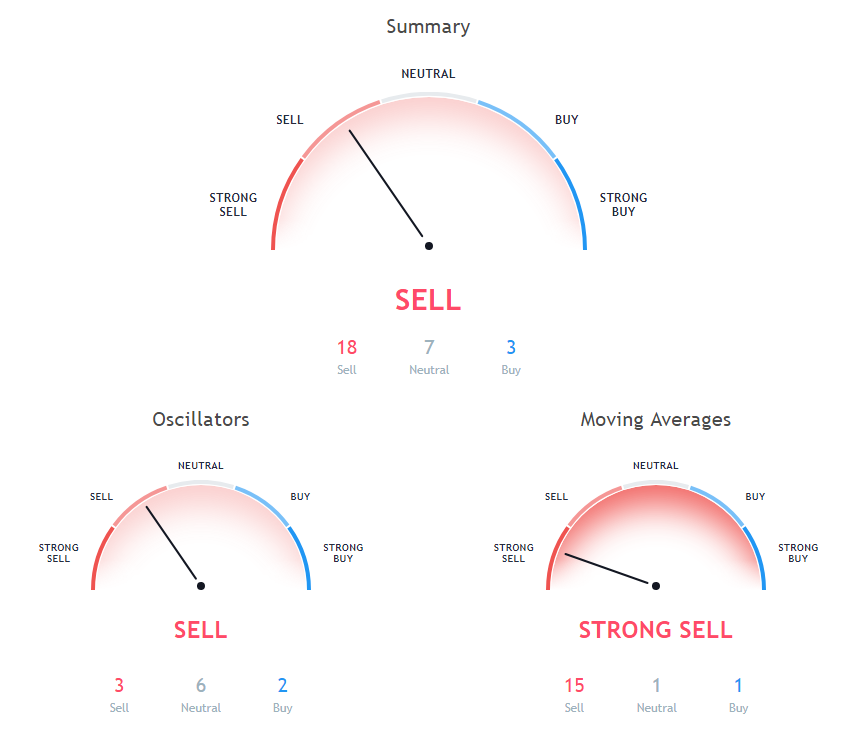
The Relative Strength Index (RSI) is an important indicator for measuring the speed and variation of price movements. Its value ranges from zero and 100. The value around 30 and below is considered an oversold region and over 70 as oversold regions. Relative Strength Index is at 19.53, indicating Neutral action.
The stochastic oscillator is a momentum indicator that compares the closing price of a security with the price range over a specific period. Stochastic oscillator is at 7.39, indicating Neutral action.
30 days Simple Moving Average is indicating Sell action with value at 190.95, Ethereum is trading below it at $125.58. 50 days Simple Moving Average is indicating Sell since Ethereum is trading at $125.58, below MAs value of 199.33. 5 days Exponential Moving Average is indicating Sell since Ethereum is trading at $125.58, below MAs value of 138.33.
50 days Exponential Moving Average is indicating Sell since Ethereum is trading at $125.58, below MAs value of 198.17. 10 days Simple Moving Average is indicating Sell since Ethereum is trading at $125.58, below MAs value of 157.99. 9 days Hull Moving Average is at 118.44, showing Buy signal, Ethereum is trading below it at $125.58.
200 days Simple Moving Average is indicating Sell action with value at 365.99, Ethereum is trading below it at $125.58. 9 days Ichimoku Cloud Base Line is indicating Neutral action with value at 172.32, Ethereum is trading below it at $125.58. 20 days Exponential Moving Average is at 173.09, showing Sell signal, Ethereum is trading below it at $125.58.
100 days Exponential Moving Average is indicating Sell action with value at 243.61, Ethereum is trading below it at $125.58. 20 days Volume Weighted Moving Average is indicating Sell since Ethereum is trading at $125.58, below MAs value of 163.62. 10 days Exponential Moving Average is at 154.54, showing Sell signal, Ethereum is trading below it at $125.58.
30 days Exponential Moving Average is at 183.12, showing Sell signal, Ethereum is trading below it at $125.58. 100 days Simple Moving Average is at 222.43, showing Sell signal, Ethereum is trading below it at $125.58. 200 days Exponential Moving Average is indicating Sell action with value at 330.2, Ethereum is trading below it at $125.58.
Also Read: Ledger Nano S vs Trezor: Review
20 days Simple Moving Average is indicating Sell action with value at 185.76, Ethereum is trading below it at $125.58. 5 days Simple Moving Average is at 135.34, showing Sell signal, Ethereum is trading below it at $125.58.
Other Technical Price Analysis for today:
Bitcoin (BTC) Price Failed To Recover Further Above $4,700 - Bitcoin Price Analysis - 23 Nov 2018
Ripple (XRP) Price Likely To Break The Recent Low Of $0.4000 - Ripple Price Analysis - 23 Nov 2018

