


Ethereum (ETH) Price Predictions / Ethereum (ETH) Forecast
| After | Price | Change |
|---|---|---|
| 1 day | $107.4378 | 0.81% |
| 1 week | $107.7664 | 1.12% |
| 1 month | $113.9179 | 6.89% |
| 6 months | $186.4249 | 74.93% |
| 1 year | $394.7373 | 270.40% |
| 5 years | $1,486.4330 | 1,294.79% |
The Relative Strength Index (RSI) is an important indicator for measuring the speed and variation of price movements. Its value ranges from zero and 100. The value around 30 and below is considered an oversold region and over 70 as oversold regions. Relative Strength Index is at 27.71, indicating Buy action.
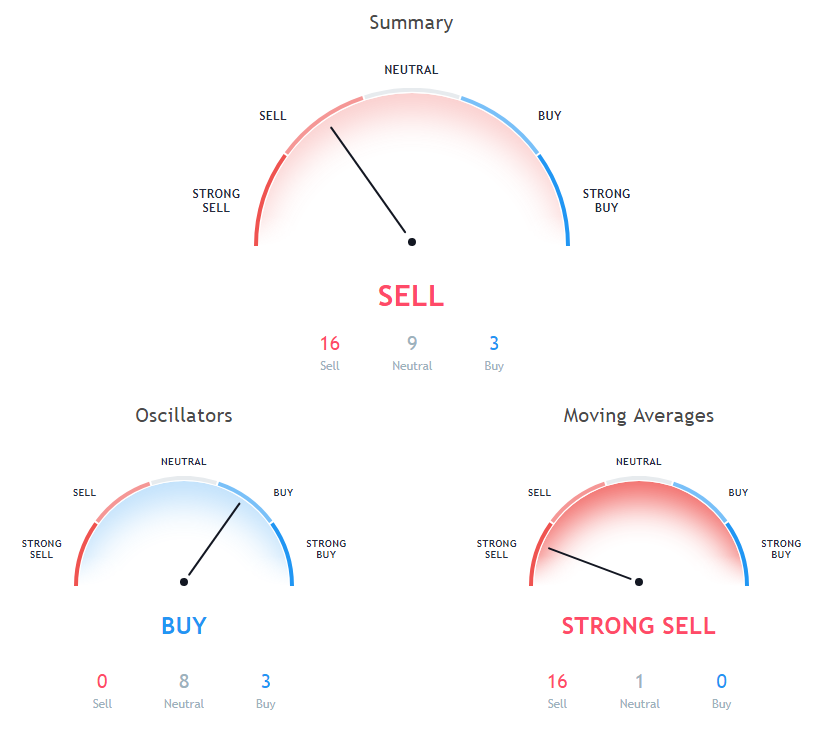
The Commodity Channel Index (CCI) is a momentum-based technical trading tool used to determine when a market is overbought or oversold. Commodity Channel Index is indicating Neutral action, with value at -80.15.
The stochastic oscillator is a momentum indicator that compares the closing price of a security with the price range over a specific period. Stochastic oscillator is at 16.26, indicating Neutral action.
10 days Simple Moving Average is indicating Sell action with value at 114.3, Ethereum is trading below it at $106.57. 200 days Exponential Moving Average is at 305.8, showing Sell signal, Ethereum is trading below it at $106.57. 30 days Exponential Moving Average is indicating Sell since Ethereum is trading at $106.57, below MAs value of 145.11.
20 days Volume Weighted Moving Average is indicating Sell since Ethereum is trading at $106.57, below MAs value of 126.98. 100 days Simple Moving Average is indicating Sell action with value at 202, Ethereum is trading below it at $106.57. 30 days Simple Moving Average is indicating Sell since Ethereum is trading at $106.57, below MAs value of 155.55.
50 days Exponential Moving Average is indicating Sell since Ethereum is trading at $106.57, below MAs value of 166.19. 5 days Exponential Moving Average is indicating Sell since Ethereum is trading at $106.57, below MAs value of 111.56. 9 days Hull Moving Average is indicating Sell action with value at 108.78, Ethereum is trading below it at $106.57.
100 days Exponential Moving Average is at 216.05, showing Sell signal, Ethereum is trading below it at $106.57. 5 days Simple Moving Average is at 112.85, showing Sell signal, Ethereum is trading below it at $106.57. 10 days Exponential Moving Average is indicating Sell since Ethereum is trading at $106.57, below MAs value of 116.77.
9 days Ichimoku Cloud Base Line is at 159.82, showing Neutral signal, Ethereum is trading below it at $106.57. 20 days Simple Moving Average is indicating Sell action with value at 129.14, Ethereum is trading below it at $106.57. 50 days Simple Moving Average is at 175.19, showing Sell signal, Ethereum is trading below it at $106.57.
Also Read: Ethereum Mining Pools
200 days Simple Moving Average is indicating Sell action with value at 330.31, Ethereum is trading below it at $106.57. 20 days Exponential Moving Average is at 131.69, showing Sell signal, Ethereum is trading below it at $106.57.
Other Technical Price Analysis for today:
Bitcoin (BTC) Price Trades Near $3870 - Bitcoin Price Analysis - 5 Dec 2018
Bitcoin Cash (BCH) Price Extended Losses Below $150 - Bitcoin Cash Price Analysis - 5 Dec 2018

