


Bitcoin (BTC) Price Predictions / Bitcoin (BTC) Forecast
| After | Price | Change |
|---|---|---|
| 1 day | $3,858.5946 | 0.22% |
| 1 week | $3,925.2023 | 1.95% |
| 1 month | $4,049.2620 | 5.18% |
| 6 months | $4,471.2698 | 16.14% |
| 1 year | $6,862.6266 | 78.25% |
| 5 years | $21,665.2025 | 462.73% |
Relative Strength Index (RSI) is an important indicator that measures speed and change of price movements. Its value ranges between zero and 100. Value around 30 and below is considered oversold region and around 70 and above considered overbought regions. Relative Strength Index is at 29.9, indicating Buy action.
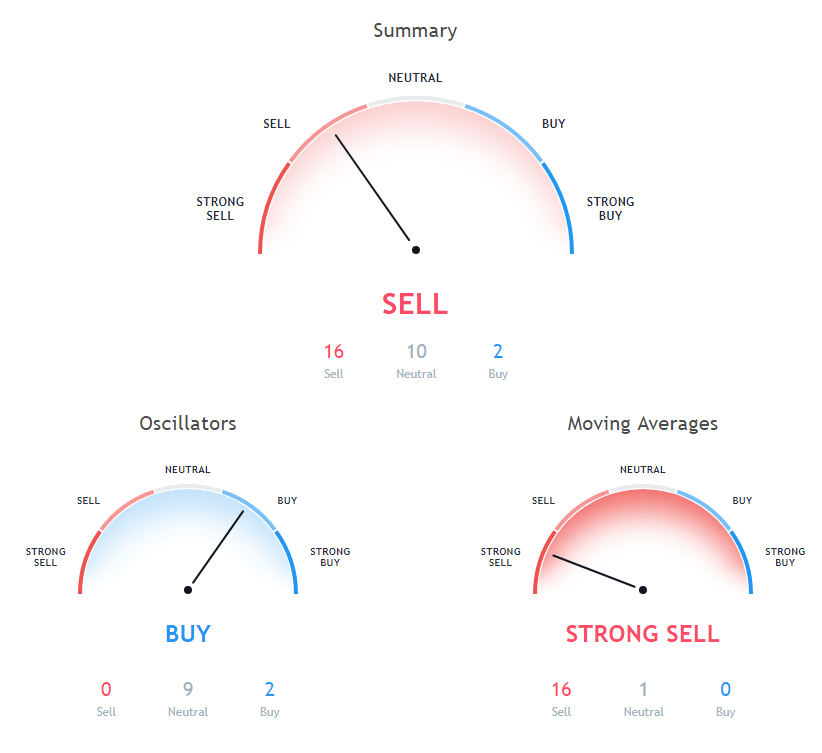
The stochastic oscillator is a momentum indicator that compares the closing price of a security with the price range over a specific period. Stochastic oscillator is indicating Neutral action, with value at 22.
The Commodity Channel Index (CCI) is a momentum oscillator used in technical analysis to measure an instrument's deviation from its statistical average. Commodity Channel Index is at -81.2, indicating Neutral action.
30 days Exponential Moving Average is indicating Sell action with value at 4827.9, Bitcoin is trading below it at $3850.01. 200 days Simple Moving Average is at 6534.7, showing Sell signal, Bitcoin is trading below it at $3850.01. 200 days Exponential Moving Average is indicating Sell action with value at 6527, Bitcoin is trading below it at $3850.01.
30 days Simple Moving Average is indicating Sell action with value at 5064.5, Bitcoin is trading below it at $3850.01. 50 days Simple Moving Average is indicating Sell since Bitcoin is trading at $3850.01, below MAs value of 5638.7. 10 days Simple Moving Average is indicating Sell action with value at 4058.1, Bitcoin is trading below it at $3850.01.
20 days Exponential Moving Average is indicating Sell action with value at 4493.1, Bitcoin is trading below it at $3850.01. 10 days Exponential Moving Average is indicating Sell action with value at 4121, Bitcoin is trading below it at $3850.01. 5 days Exponential Moving Average is indicating Sell action with value at 3990.8, Bitcoin is trading below it at $3850.01.
20 days Simple Moving Average is indicating Sell since Bitcoin is trading at $3850.01, below MAs value of 4424.5. 9 days Ichimoku Cloud Base Line is indicating Neutral since Bitcoin is trading at $3850.01, below MAs value of 5079.4. 50 days Exponential Moving Average is indicating Sell action with value at 5285.5, Bitcoin is trading below it at $3850.01.
100 days Simple Moving Average is at 6125.8, showing Sell signal, Bitcoin is trading below it at $3850.01. 9 days Hull Moving Average is indicating Sell action with value at 3910.4, Bitcoin is trading below it at $3850.01. 100 days Exponential Moving Average is indicating Sell action with value at 5883.4, Bitcoin is trading below it at $3850.01.
Also Read: Best Ways to Buy Bitcoin with Western Union in 2018
5 days Simple Moving Average is indicating Sell action with value at 4033.5, Bitcoin is trading below it at $3850.01. 20 days Volume Weighted Moving Average is indicating Sell since Bitcoin is trading at $3850.01, below MAs value of 4324.
Other Technical Price Analysis for today:
Bitcoin Cash (BCH) Price Extended Losses Below $150 - Bitcoin Cash Price Analysis - 5 Dec 2018
Ethereum (ETH) Price Failed To Break The $113-114 Resistance - Ethereum Price Analysis - 5 Dec 2018

