


Ethereum (ETH) Price Predictions / Ethereum (ETH) Forecast
| After | Price | Change |
|---|---|---|
| 1 day | $113.0129 | 0.90% |
| 1 week | $112.7545 | 0.66% |
| 1 month | $112.9482 | 0.84% |
| 6 months | $186.1069 | 66.15% |
| 1 year | $392.9381 | 250.81% |
| 5 years | $1,485.9177 | 1,226.59% |
The Stochastic Oscillator is a range bound momentum oscillator. Stochastic oscillator is indicating Buy action, with value at 19.98.
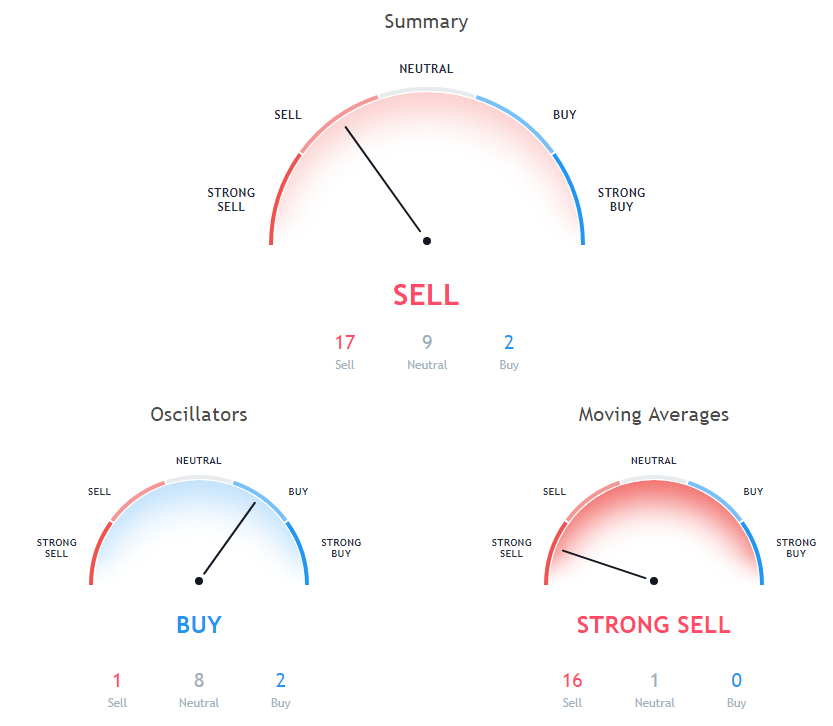
The Relative Strength Index (RSI) is an important indicator for measuring the speed and variation of price movements. Its value ranges from zero and 100. The value around 30 and below is considered an oversold region and over 70 as oversold regions. Relative Strength Index is showing Neutral signal, with value at 30.69.
The Commodity Channel Index (CCI) is a momentum oscillator used in technical analysis to measure an instrument's deviation from its statistical average. Commodity Channel Index is showing Neutral signal, with value at -64.58.
50 days Simple Moving Average is at 177.39, showing Sell signal, Ethereum is trading below it at $112.01. 10 days Exponential Moving Average is at 119.23, showing Sell signal, Ethereum is trading below it at $112.01. 200 days Exponential Moving Average is indicating Sell action with value at 307.82, Ethereum is trading below it at $112.01.
5 days Exponential Moving Average is indicating Sell since Ethereum is trading at $112.01, below MAs value of 114.33. 20 days Exponential Moving Average is indicating Sell action with value at 134.44, Ethereum is trading below it at $112.01. 9 days Ichimoku Cloud Base Line is at 159.82, showing Neutral signal, Ethereum is trading below it at $112.01.
10 days Simple Moving Average is indicating Sell action with value at 115.64, Ethereum is trading below it at $112.01. 100 days Simple Moving Average is indicating Sell action with value at 203.83, Ethereum is trading below it at $112.01. 9 days Hull Moving Average is indicating Buy action with value at 112.96, Ethereum is trading below it at $112.01.
20 days Volume Weighted Moving Average is at 130.08, showing Sell signal, Ethereum is trading below it at $112.01. 30 days Exponential Moving Average is indicating Sell action with value at 147.85, Ethereum is trading below it at $112.01. 5 days Simple Moving Average is at 114.53, showing Sell signal, Ethereum is trading below it at $112.01.
50 days Exponential Moving Average is indicating Sell since Ethereum is trading at $112.01, below MAs value of 168.67. 100 days Exponential Moving Average is indicating Sell since Ethereum is trading at $112.01, below MAs value of 218.28. 20 days Simple Moving Average is indicating Sell since Ethereum is trading at $112.01, below MAs value of 133.08.
Also Read: 5 Best Altcoin Exchanges and Trading Platforms of 2018
30 days Simple Moving Average is at 159.07, showing Sell signal, Ethereum is trading below it at $112.01. 200 days Simple Moving Average is at 333.27, showing Sell signal, Ethereum is trading below it at $112.01.
Other Technical Price Analysis for today:
Bitcoin (BTC) Price Declined Towards $3,750 Level - Bitcoin Price Analysis - 4 Dec 2018
Ripple (XRP) Price Is In A Bearish Zone - Ripple Price Analysis - 4 Dec 2018

