


Bitcoin (BTC) Price Predictions / Bitcoin (BTC) Forecast
| After | Price | Change |
|---|---|---|
| 1 day | $4,012.5938 | 0.10% |
| 1 week | $4,052.4051 | 1.09% |
| 1 month | $3,995.1651 | -0.33% |
| 6 months | $4,407.4332 | 9.95% |
| 1 year | $6,819.8137 | 70.13% |
| 5 years | $21,610.2122 | 439.10% |
The Commodity Channel Index (CCI) is a momentum-based technical trading tool used to determine when a market is overbought or oversold. Commodity Channel Index is at -61.4, indicating Neutral action.
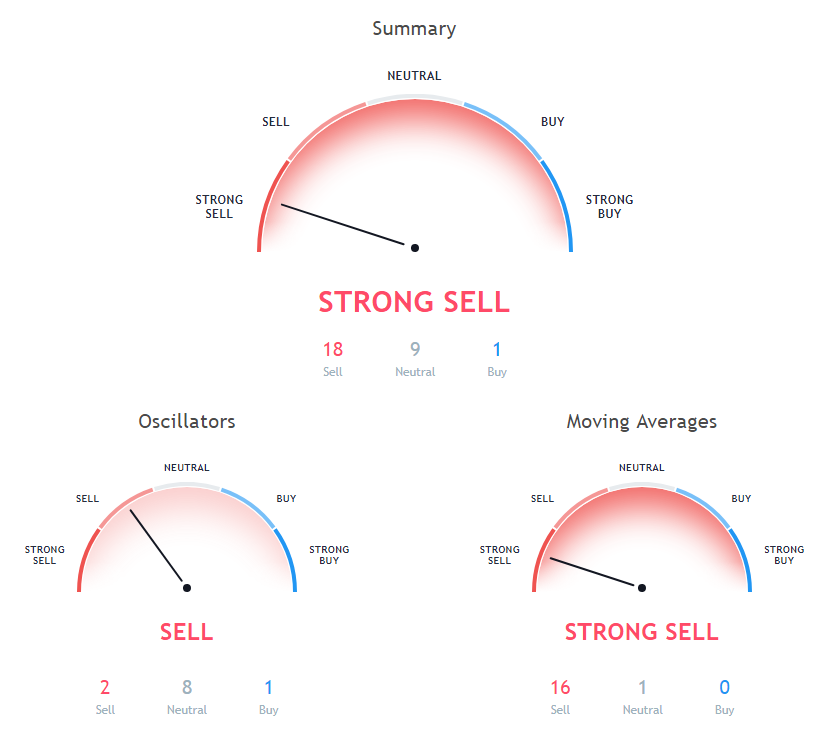
The Relative Strength Index (RSI) is an important indicator for measuring the speed and variation of price movements. Its value ranges from zero and 100. The value around 30 and below is considered an oversold region and over 70 as oversold regions. Relative Strength Index is at 33.2, indicating Neutral action.
The stochastic oscillator is a momentum indicator that compares the closing price of a security with the price range over a specific period. Stochastic oscillator is at 25.8, indicating Neutral action.
10 days Exponential Moving Average is indicating Sell action with value at 4187.9, Bitcoin is trading below it at $4008.56. 9 days Ichimoku Cloud Base Line is indicating Neutral since Bitcoin is trading at $4008.56, below MAs value of 5081. 5 days Simple Moving Average is at 4079.7, showing Sell signal, Bitcoin is trading below it at $4008.56.
50 days Simple Moving Average is at 5697.6, showing Sell signal, Bitcoin is trading below it at $4008.56. 200 days Exponential Moving Average is at 6554.3, showing Sell signal, Bitcoin is trading below it at $4008.56. 5 days Exponential Moving Average is at 4071.7, showing Sell signal, Bitcoin is trading below it at $4008.56.
10 days Simple Moving Average is at 4086.1, showing Sell signal, Bitcoin is trading below it at $4008.56. 20 days Simple Moving Average is indicating Sell action with value at 4521.5, Bitcoin is trading below it at $4008.56. 30 days Simple Moving Average is indicating Sell action with value at 5153.2, Bitcoin is trading below it at $4008.56.
100 days Exponential Moving Average is at 5925.3, showing Sell signal, Bitcoin is trading below it at $4008.56. 20 days Volume Weighted Moving Average is indicating Sell action with value at 4417.9, Bitcoin is trading below it at $4008.56. 100 days Simple Moving Average is at 6156.8, showing Sell signal, Bitcoin is trading below it at $4008.56.
9 days Hull Moving Average is indicating Sell action with value at 4043.6, Bitcoin is trading below it at $4008.56. 20 days Exponential Moving Average is at 4564.6, showing Sell signal, Bitcoin is trading below it at $4008.56. 30 days Exponential Moving Average is indicating Sell since Bitcoin is trading at $4008.56, below MAs value of 4897.9.
Also Read: What Will Happen After All Bitcoins Are Mined?
200 days Simple Moving Average is at 6556.8, showing Sell signal, Bitcoin is trading below it at $4008.56. 50 days Exponential Moving Average is indicating Sell action with value at 5345.7, Bitcoin is trading below it at $4008.56.
Other Technical Price Analysis for today:
Ethereum (ETH) Price May Move Down And Test$102 Support - Ethereum Price Analysis - 4 Dec 2018
Ripple (XRP) Price Is In A Bearish Zone - Ripple Price Analysis - 4 Dec 2018

