


Ethereum (ETH) Price Predictions / Ethereum (ETH) Forecast
| After | Price | Change |
|---|---|---|
| 1 day | $199.0393 | 0.63% |
| 1 week | $198.4708 | 0.34% |
| 1 month | $199.0238 | 0.62% |
| 6 months | $297.8702 | 50.60% |
| 1 year | $462.7054 | 133.94% |
| 5 years | $1,593.1272 | 705.46% |
The Relative Strength Index (RSI) is an important indicator for measuring the speed and variation of price movements. Its value ranges from zero and 100. The value around 30 and below is considered an oversold region and over 70 as oversold regions. Relative Strength Index is indicating Neutral action, with value at 39.73.
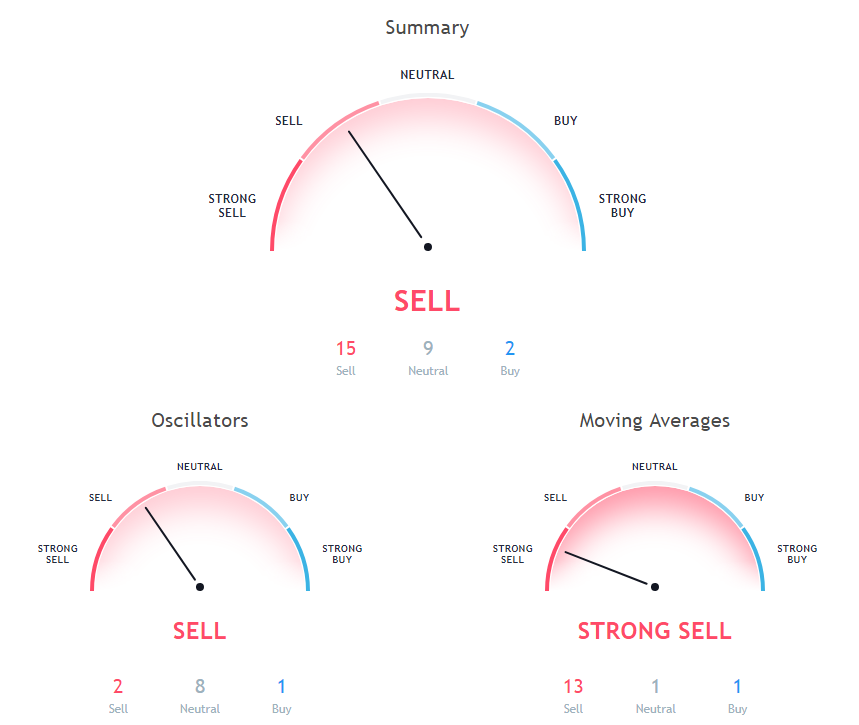
The stochastic oscillator is a momentum indicator that compares the closing price of a security with the price range over a specific period. Stochastic oscillator is showing Neutral signal, with value at 21.77.
The Commodity Channel Index (CCI) is a momentum oscillator used in technical analysis to measure an instrument's deviation from its statistical average. Commodity Channel Index is showing Neutral signal, with value at -100.41.
20 days Simple Moving Average is at 204.69, showing Sell signal, Ethereum is trading below it at $197.79. 50 days Exponential Moving Average is at 223.75, showing Sell signal, Ethereum is trading below it at $197.79. 100 days Exponential Moving Average is indicating Sell action with value at 276.73, Ethereum is trading below it at $197.79.
200 days Simple Moving Average is indicating Sell since Ethereum is trading at $197.79, below MAs value of 418.15. 50 days Simple Moving Average is at 215.18, showing Sell signal, Ethereum is trading below it at $197.79. 10 days Exponential Moving Average is indicating Sell since Ethereum is trading at $197.79, below MAs value of 201.59.
30 days Simple Moving Average is at 209.69, showing Sell signal, Ethereum is trading below it at $197.79. 30 days Exponential Moving Average is at 209.86, showing Sell signal, Ethereum is trading below it at $197.79. 100 days Simple Moving Average is indicating Sell action with value at 267.3, Ethereum is trading below it at $197.79.
9 days Ichimoku Cloud Base Line is at 215.49, showing Neutral signal, Ethereum is trading below it at $197.79. 20 days Exponential Moving Average is indicating Sell action with value at 205.43, Ethereum is trading below it at $197.79. 10 days Simple Moving Average is indicating Sell action with value at 202.06, Ethereum is trading below it at $197.79.
Also Read: Ultimate Cryptocurrency Mining Guide
20 days Volume Weighted Moving Average is at 207.42, showing Sell signal, Ethereum is trading below it at $197.79. 9 days Hull Moving Average is indicating Buy since Ethereum is trading at $197.79, below MAs value of 196.33. 200 days Exponential Moving Average is at 365.81, showing Sell signal, Ethereum is trading below it at $197.79.
Other Technical Price Analysis for today:
Bitcoin (BTC) Price Is Under Pressure Below $6,300 - Bitcoin Price Analysis - 1 Nov 2018
Ripple (XRP) Price Likely To Clear The $0.4500 Resistance - Ripple Price Analysis - 1 Nov 2018

