


Bitcoin (BTC) Price Predictions / Bitcoin (BTC) Forecast
| After | Price | Change |
|---|---|---|
| 1 day | $4,057.5692 | 0.64% |
| 1 week | $4,044.8669 | 0.33% |
| 1 month | $3,945.9437 | -2.13% |
| 6 months | $4,310.3752 | 6.91% |
| 1 year | $6,824.3578 | 69.27% |
| 5 years | $21,565.0105 | 434.88% |
Relative Strength Index (RSI) is an important indicator that measures speed and change of price movements. Its value ranges between zero and 100. Value around 30 and below is considered oversold region and around 70 and above considered overbought regions. Relative Strength Index is at 24.4, indicating Neutral action.
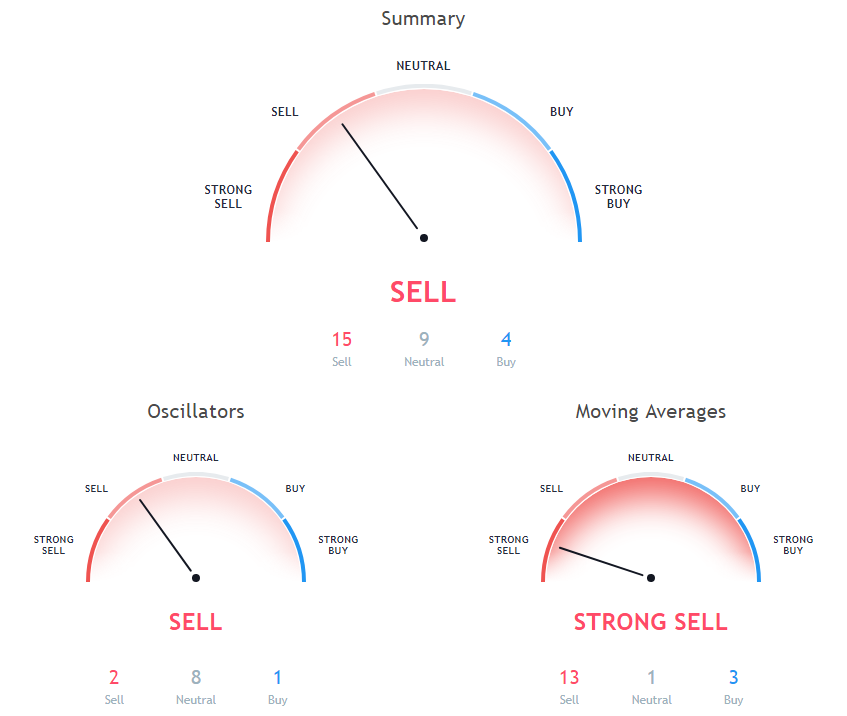
The Stochastic Oscillator is a range bound momentum oscillator. Stochastic oscillator is indicating Neutral action, with value at 11.4.
The Commodity Channel Index (CCI) is a momentum-based technical trading tool used to determine when a market is overbought or oversold. Commodity Channel Index is at -80.6, indicating Neutral action.
Moving averages come in many forms, but their use remains the same: to help traders identify the trends of assets by smoothing out the day-to-day price fluctuations.
30 days Exponential Moving Average is indicating Sell since Bitcoin is trading at $4031.74, below MAs value of 5272. 10 days Exponential Moving Average is indicating Sell since Bitcoin is trading at $4031.74, below MAs value of 4378. 20 days Exponential Moving Average is indicating Sell since Bitcoin is trading at $4031.74, below MAs value of 4922.8.
9 days Hull Moving Average is at 3806, showing Buy signal, Bitcoin is trading below it at $4031.74. 5 days Simple Moving Average is indicating Buy action with value at 3971.6, Bitcoin is trading below it at $4031.74. 30 days Simple Moving Average is indicating Sell action with value at 5602.6, Bitcoin is trading below it at $4031.74.
200 days Simple Moving Average is indicating Sell action with value at 6684.4, Bitcoin is trading below it at $4031.74. 10 days Simple Moving Average is indicating Sell since Bitcoin is trading at $4031.74, below MAs value of 4280.5. 200 days Exponential Moving Average is indicating Sell action with value at 6702.8, Bitcoin is trading below it at $4031.74.
20 days Volume Weighted Moving Average is at 4732.9, showing Sell signal, Bitcoin is trading below it at $4031.74. 9 days Ichimoku Cloud Base Line is indicating Neutral action with value at 5136.3, Bitcoin is trading below it at $4031.74. 50 days Exponential Moving Average is indicating Sell since Bitcoin is trading at $4031.74, below MAs value of 5671.6.
100 days Exponential Moving Average is indicating Sell action with value at 6151.6, Bitcoin is trading below it at $4031.74. 20 days Simple Moving Average is indicating Sell since Bitcoin is trading at $4031.74, below MAs value of 5181.2. 5 days Exponential Moving Average is at 4077.3, showing Buy signal, Bitcoin is trading below it at $4031.74.
Also Read: Bitcoin Mining Pools
100 days Simple Moving Average is indicating Sell action with value at 6302.5, Bitcoin is trading below it at $4031.74. 50 days Simple Moving Average is at 5970.5, showing Sell signal, Bitcoin is trading below it at $4031.74.
Other Technical Price Analysis for today:
Ripple (XRP) Price Slowly Gains Bullish Pace - Ripple Price Analysis - 28 Nov 2018

