


Bitcoin (BTC) Price Predictions / Bitcoin (BTC) Forecast
| After | Price | Change |
|---|---|---|
| 1 day | $3,978.8451 | 0.46% |
| 1 week | $4,031.9415 | 1.80% |
| 1 month | $4,124.9769 | 4.15% |
| 6 months | $4,468.3183 | 12.82% |
| 1 year | $6,998.4826 | 76.70% |
| 5 years | $21,756.4259 | 449.31% |
The stochastic oscillator is a momentum indicator that compares the closing price of a security with the price range over a specific period. Stochastic oscillator is showing Neutral signal, with value at 10.8.
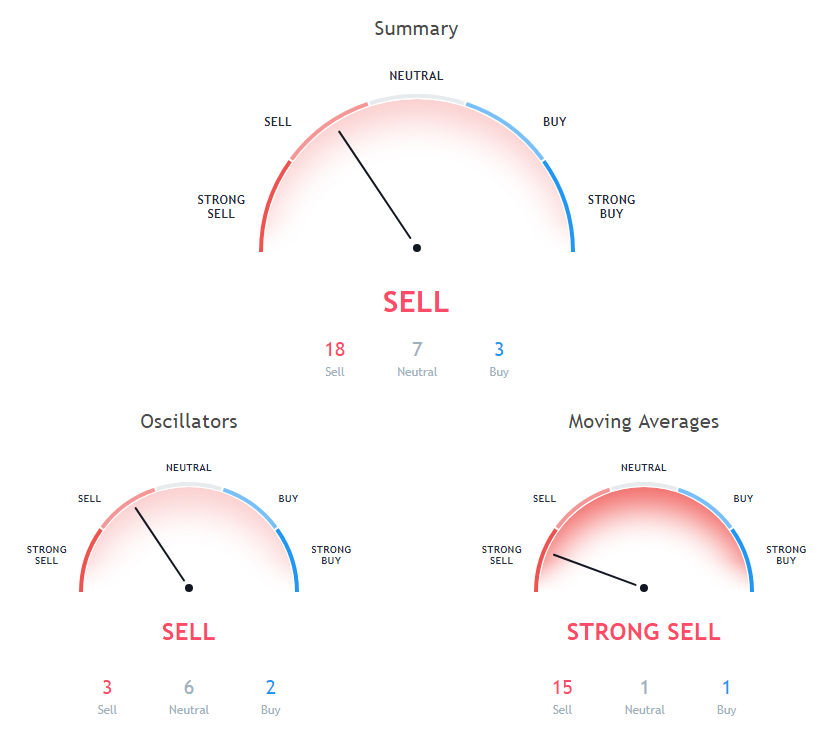
The Commodity Channel Index (CCI) is a momentum oscillator used in technical analysis to measure an instrument's deviation from its statistical average. Commodity Channel Index is at -110.1, indicating Buy action.
The Relative Strength Index (RSI) is an important indicator for measuring the speed and variation of price movements. Its value ranges from zero and 100. The value around 30 and below is considered an oversold region and over 70 as oversold regions. Relative Strength Index is at 17.3, indicating Buy action.
Moving Average (MA) in simple term is just average of any subset of numbers. For example, 50 Days simple moving average is calculated at any point in chart by summing past 50 days of price and then dividing it by 50.
10 days Simple Moving Average is indicating Sell since Bitcoin is trading at $3960.69, below MAs value of 4628.4. 5 days Exponential Moving Average is indicating Sell action with value at 4219.1, Bitcoin is trading below it at $3960.69. 20 days Volume Weighted Moving Average is at 4938, showing Sell signal, Bitcoin is trading below it at $3960.69.
30 days Exponential Moving Average is at 5465.6, showing Sell signal, Bitcoin is trading below it at $3960.69. 10 days Exponential Moving Average is indicating Sell since Bitcoin is trading at $3960.69, below MAs value of 4596. 20 days Exponential Moving Average is indicating Sell since Bitcoin is trading at $3960.69, below MAs value of 5144.8.
30 days Simple Moving Average is indicating Sell action with value at 5770.2, Bitcoin is trading below it at $3960.69. 9 days Hull Moving Average is indicating Buy action with value at 3862, Bitcoin is trading below it at $3960.69. 5 days Simple Moving Average is at 4168.4, showing Sell signal, Bitcoin is trading below it at $3960.69.
50 days Exponential Moving Average is indicating Sell since Bitcoin is trading at $3960.69, below MAs value of 5818.2. 50 days Simple Moving Average is indicating Sell since Bitcoin is trading at $3960.69, below MAs value of 6081. 200 days Exponential Moving Average is at 6759.3, showing Sell signal, Bitcoin is trading below it at $3960.69.
100 days Exponential Moving Average is indicating Sell action with value at 6243.2, Bitcoin is trading below it at $3960.69. 20 days Simple Moving Average is at 5443.2, showing Sell signal, Bitcoin is trading below it at $3960.69. 100 days Simple Moving Average is at 6351.8, showing Sell signal, Bitcoin is trading below it at $3960.69.
Also Read: Best Bitcoin Cloud Mining Platforms of 2018
9 days Ichimoku Cloud Base Line is indicating Neutral since Bitcoin is trading at $3960.69, below MAs value of 5136.3. 200 days Simple Moving Average is at 6729.8, showing Sell signal, Bitcoin is trading below it at $3960.69.
Other Technical Price Analysis for today:
Ripple (XRP) Price Face Heavy Selling Pressure - Ripple Price Analysis - 26 Nov 2018

