


Bitcoin (BTC) Price Predictions / Bitcoin (BTC) Forecast
| After | Price | Change |
|---|---|---|
| 1 day | $4,664.9469 | 0.26% |
| 1 week | $4,683.3478 | 0.66% |
| 1 month | $4,485.6788 | -3.59% |
| 6 months | $4,790.4183 | 2.96% |
| 1 year | $7,349.7200 | 57.97% |
| 5 years | $22,150.7582 | 376.09% |
Relative Strength Index (RSI) is an important indicator that measures speed and change of price movements. Its value ranges between zero and 100. Value around 30 and below is considered oversold region and around 70 and above considered overbought regions. Relative Strength Index is showing Neutral signal, with value at 18.1.
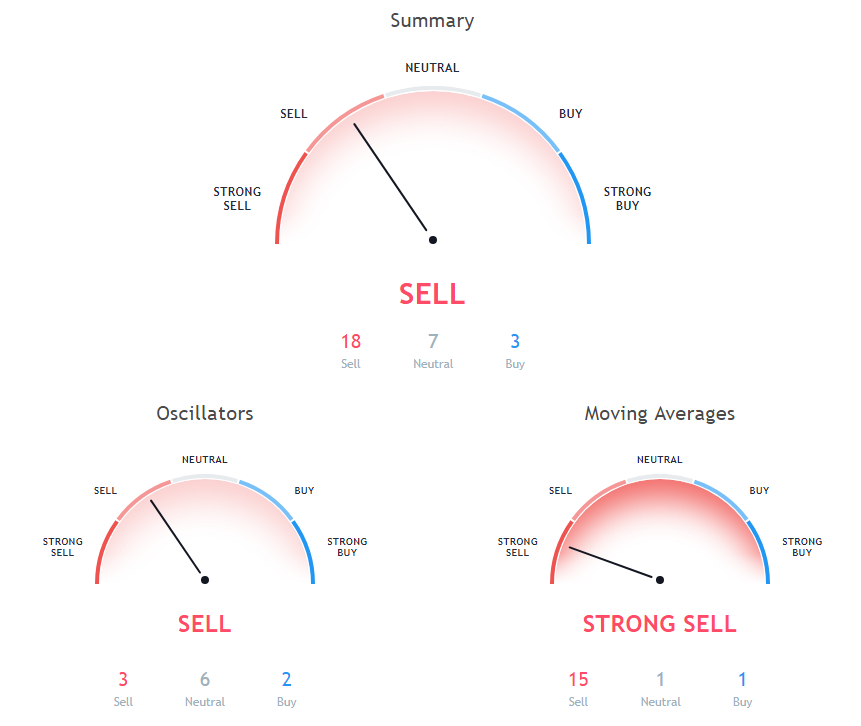
The Commodity Channel Index (CCI) is a momentum-based technical trading tool used to determine when a market is overbought or oversold. Commodity Channel Index is at -160, indicating Buy action.
The stochastic oscillator is a momentum indicator that compares the closing price of a security with the price range over a specific period. Stochastic oscillator is indicating Neutral action, with value at 11.6.
50 days Exponential Moving Average is at 6188.6, showing Sell signal, Bitcoin is trading below it at $4652.64. 9 days Hull Moving Average is at 4602.6, showing Buy signal, Bitcoin is trading below it at $4652.64. 20 days Volume Weighted Moving Average is indicating Sell action with value at 5451.7, Bitcoin is trading below it at $4652.64.
9 days Ichimoku Cloud Base Line is at 5459.3, showing Neutral signal, Bitcoin is trading below it at $4652.64. 200 days Simple Moving Average is indicating Sell action with value at 6858.7, Bitcoin is trading below it at $4652.64. 5 days Exponential Moving Average is at 5040.1, showing Sell signal, Bitcoin is trading below it at $4652.64.
10 days Exponential Moving Average is indicating Sell since Bitcoin is trading at $4652.64, below MAs value of 5415.6. 100 days Exponential Moving Average is at 6463.5, showing Sell signal, Bitcoin is trading below it at $4652.64. 100 days Simple Moving Average is indicating Sell action with value at 6461.7, Bitcoin is trading below it at $4652.64.
10 days Simple Moving Average is indicating Sell action with value at 5575.9, Bitcoin is trading below it at $4652.64. 200 days Exponential Moving Average is indicating Sell action with value at 6893.1, Bitcoin is trading below it at $4652.64. 30 days Simple Moving Average is at 6167, showing Sell signal, Bitcoin is trading below it at $4652.64.
20 days Exponential Moving Average is indicating Sell action with value at 5799.6, Bitcoin is trading below it at $4652.64. 30 days Exponential Moving Average is at 5989.6, showing Sell signal, Bitcoin is trading below it at $4652.64. 20 days Simple Moving Average is indicating Sell action with value at 6020.3, Bitcoin is trading below it at $4652.64.
Also Read: Best Ways to Buy Bitcoin with Western Union in 2018
5 days Simple Moving Average is indicating Sell since Bitcoin is trading at $4652.64, below MAs value of 5105.1. 50 days Simple Moving Average is indicating Sell action with value at 6324.6, Bitcoin is trading below it at $4652.64.
Other Technical Price Analysis for today:

