


Bitcoin (BTC) Price Predictions / Bitcoin (BTC) Forecast
| After | Price | Change |
|---|---|---|
| 1 day | $3,410.1868 | 0.89% |
| 1 week | $3,400.6019 | 0.61% |
| 1 month | $3,555.4976 | 5.19% |
| 6 months | $4,077.9328 | 20.64% |
| 1 year | $6,205.4973 | 83.59% |
| 5 years | $21,182.3367 | 526.68% |
The Commodity Channel Index (CCI) is a momentum-based technical trading tool used to determine when a market is overbought or oversold. Commodity Channel Index is indicating Neutral action, with value at -121.7.
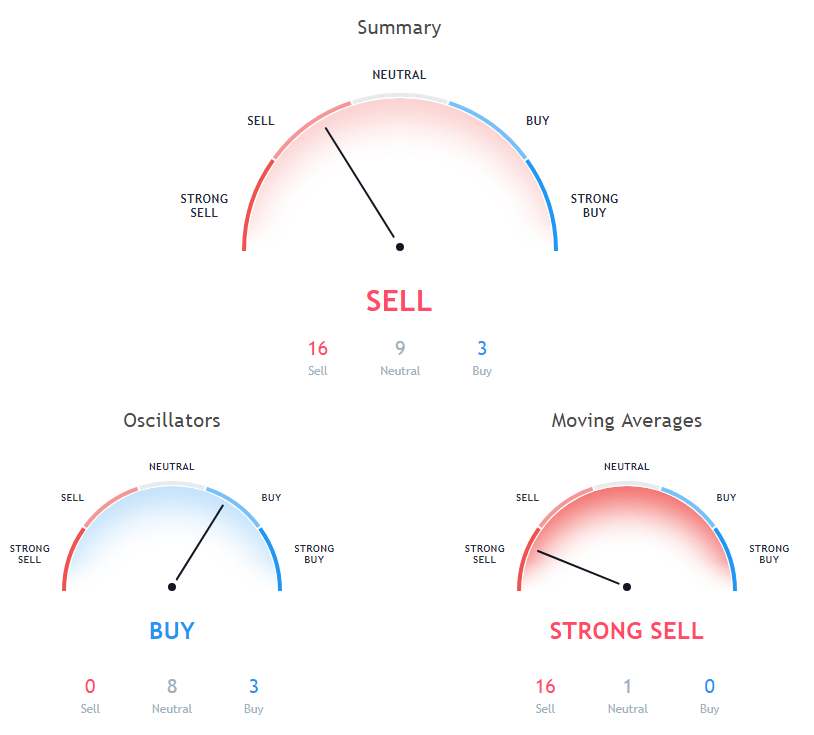
The Relative Strength Index (RSI) is an important indicator for measuring the speed and variation of price movements. Its value ranges from zero and 100. The value around 30 and below is considered an oversold region and over 70 as oversold regions. Relative Strength Index is at 28.2, indicating Buy action.
The Stochastic Oscillator is a range bound momentum oscillator. Stochastic oscillator is showing Neutral signal, with value at 21.
Moving averages come in many forms, but their use remains the same: to help traders identify the trends of assets by smoothing out the day-to-day price fluctuations.
10 days Simple Moving Average is indicating Sell action with value at 3692.1, Bitcoin is trading below it at $3380.11. 20 days Volume Weighted Moving Average is indicating Sell action with value at 3926.4, Bitcoin is trading below it at $3380.11. 100 days Exponential Moving Average is at 5613.9, showing Sell signal, Bitcoin is trading below it at $3380.11.
30 days Exponential Moving Average is indicating Sell action with value at 4390.5, Bitcoin is trading below it at $3380.11. 9 days Ichimoku Cloud Base Line is indicating Neutral action with value at 4527.6, Bitcoin is trading below it at $3380.11. 5 days Exponential Moving Average is indicating Sell since Bitcoin is trading at $3380.11, below MAs value of 3542.4.
200 days Exponential Moving Average is indicating Sell action with value at 6350.7, Bitcoin is trading below it at $3380.11. 50 days Simple Moving Average is indicating Sell since Bitcoin is trading at $3380.11, below MAs value of 5266.3. 20 days Simple Moving Average is indicating Sell action with value at 3919.4, Bitcoin is trading below it at $3380.11.
5 days Simple Moving Average is at 3512.3, showing Sell signal, Bitcoin is trading below it at $3380.11. 50 days Exponential Moving Average is at 4904.7, showing Sell signal, Bitcoin is trading below it at $3380.11. 20 days Exponential Moving Average is indicating Sell action with value at 4045.8, Bitcoin is trading below it at $3380.11.
200 days Simple Moving Average is indicating Sell action with value at 6402.5, Bitcoin is trading below it at $3380.11. 100 days Simple Moving Average is at 5909.6, showing Sell signal, Bitcoin is trading below it at $3380.11. 10 days Exponential Moving Average is at 3688.4, showing Sell signal, Bitcoin is trading below it at $3380.11.
Also Read: Top 10 Best Bitcoin Payment Gateways of 2018
30 days Simple Moving Average is indicating Sell action with value at 4468.8, Bitcoin is trading below it at $3380.11. 9 days Hull Moving Average is at 3460.4, showing Sell signal, Bitcoin is trading below it at $3380.11.
Other Technical Price Analysis for today:
Ethereum (ETH) Price Traded Below $92 Support Level - Ethereum Price Analysis - 11 Dec 2018
Monero (XMR) Price Faces Pressure Below $50 - Monero Price Analysis - 11 Dec 2018

