


Bitcoin Cash (BCH) Price Predictions / Bitcoin Cash (BCH) Forecast
| After | Price | Change |
|---|---|---|
| 1 day | $526.0834 | 0.39% |
| 1 week | $525.0930 | 0.20% |
| 1 month | $525.9344 | 0.36% |
| 6 months | $716.5169 | 36.73% |
| 1 year | $1,119.2103 | 113.57% |
| 5 years | $3,497.0267 | 567.32% |
We've applied Technical Analysis to the price of Bitcoin Cash (BCH/USD) for today and predict where price is headed.
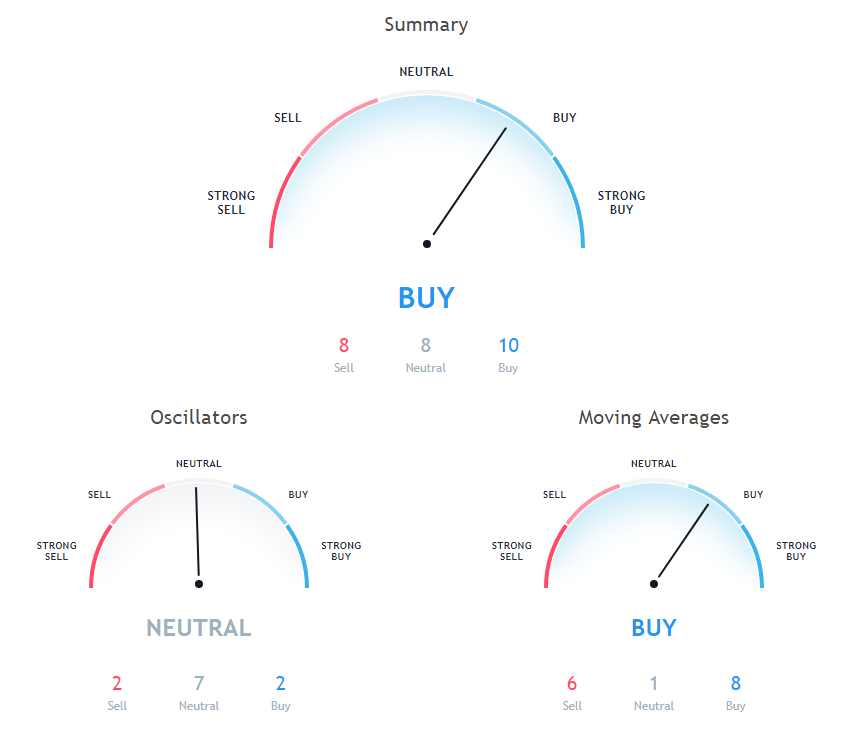
The Stochastic Oscillator is a range bound momentum oscillator. Stochastic oscillator is at 57.4, indicating Neutral action.
The Relative Strength Index (RSI) is an important indicator for measuring the speed and variation of price movements. Its value ranges from zero and 100. The value around 30 and below is considered an oversold region and over 70 as oversold regions. Relative Strength Index is showing Neutral signal, with value at 53.2.
The Commodity Channel Index (CCI) is a momentum-based technical trading tool used to determine when a market is overbought or oversold. Commodity Channel Index is indicating Neutral action, with value at 44.5.
10 days Simple Moving Average is at 524.7, showing Buy signal, Bitcoin Cash is trading below it at $524.04. 20 days Exponential Moving Average is at 512.3, showing Buy signal, Bitcoin Cash is trading below it at $524.04. 50 days Simple Moving Average is indicating Buy action with value at 512.1, Bitcoin Cash is trading below it at $524.04.
9 days Ichimoku Cloud Base Line is at 498.9, showing Neutral signal, Bitcoin Cash is trading below it at $524.04. 200 days Simple Moving Average is indicating Sell action with value at 821.7, Bitcoin Cash is trading below it at $524.04. 20 days Simple Moving Average is indicating Buy action with value at 507, Bitcoin Cash is trading below it at $524.04.
100 days Exponential Moving Average is indicating Sell since Bitcoin Cash is trading at $524.04, below MAs value of 625.1. 20 days Volume Weighted Moving Average is indicating Buy action with value at 516.3, Bitcoin Cash is trading below it at $524.04. 30 days Exponential Moving Average is at 513.6, showing Buy signal, Bitcoin Cash is trading below it at $524.04.
200 days Exponential Moving Average is indicating Sell since Bitcoin Cash is trading at $524.04, below MAs value of 758.2. 100 days Simple Moving Average is indicating Sell action with value at 612.3, Bitcoin Cash is trading below it at $524.04. 9 days Hull Moving Average is indicating Buy action with value at 516.8, Bitcoin Cash is trading below it at $524.04.
Also Read: Beginners Guide to Binance Cryptocurrency Exchange
30 days Simple Moving Average is indicating Buy since Bitcoin Cash is trading at $524.04, below MAs value of 487.3. 10 days Exponential Moving Average is indicating Buy since Bitcoin Cash is trading at $524.04, below MAs value of 519.1. 50 days Exponential Moving Average is at 534.9, showing Sell signal, Bitcoin Cash is trading below it at $524.04.
Other Technical Price Analysis for today:
Bitcoin (BTC) Bulls Get Upper Hand - Bitcoin Price Analysis - 8 Oct 2018
Ripple (XRP) Bulls Lose Their Grip with Under $0.5000 - Ripple Price Analysis - 8 Oct 2018

