


Bitcoin Cash (BCH) Price Predictions / Bitcoin Cash (BCH) Forecast
| After | Price | Change |
|---|---|---|
| 1 day | $429.0849 | 0.81% |
| 1 week | $434.0378 | 1.98% |
| 1 month | $428.9736 | 0.79% |
| 6 months | $595.3242 | 39.87% |
| 1 year | $1,020.1268 | 139.67% |
| 5 years | $3,381.2756 | 694.42% |
The Commodity Channel Index (CCI) is a momentum-based technical trading tool used to determine when a market is overbought or oversold. Commodity Channel Index is at -105.8, indicating Buy action.
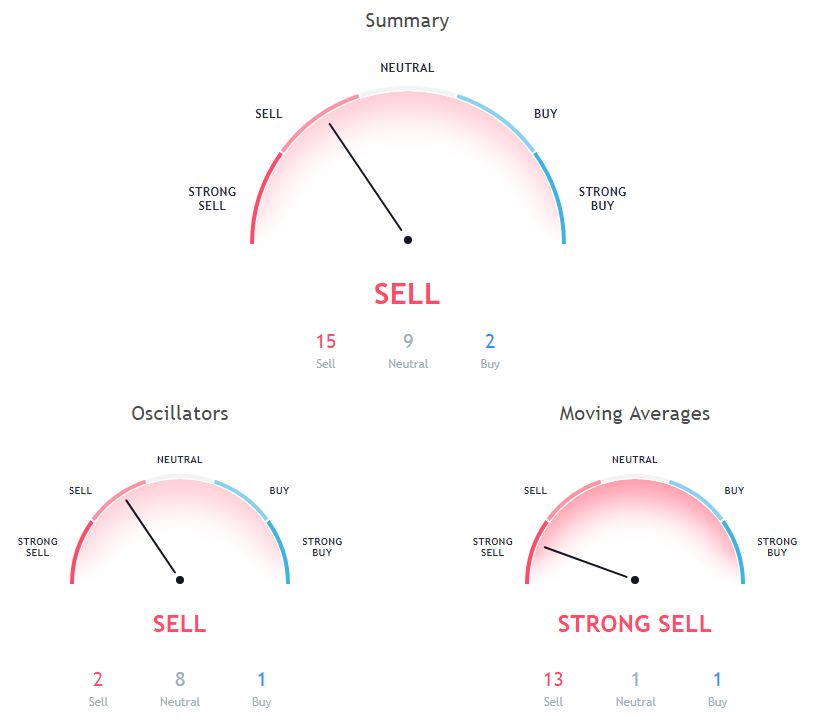
Relative Strength Index (RSI) is an important indicator that measures speed and change of price movements. Its value ranges between zero and 100. Value around 30 and below is considered oversold region and around 70 and above considered overbought regions. Relative Strength Index is indicating Neutral action, with value at 37.9.
The Stochastic Oscillator is a range bound momentum oscillator. Stochastic oscillator is indicating Neutral action, with value at 29.6.
Moving Average (MA) in simple term is just average of any subset of numbers. For example, 50 Days simple moving average is calculated at any point in chart by summing past 50 days of price and then dividing it by 50.
200 days Exponential Moving Average is indicating Sell action with value at 690, Bitcoin Cash is trading below it at $425.63. 100 days Simple Moving Average is indicating Sell since Bitcoin Cash is trading at $425.63, below MAs value of 534.2. 50 days Exponential Moving Average is indicating Sell since Bitcoin Cash is trading at $425.63, below MAs value of 478.8.
10 days Exponential Moving Average is indicating Sell action with value at 434, Bitcoin Cash is trading below it at $425.63. 9 days Ichimoku Cloud Base Line is at 473.1, showing Neutral signal, Bitcoin Cash is trading below it at $425.63. 100 days Exponential Moving Average is at 555.6, showing Sell signal, Bitcoin Cash is trading below it at $425.63.
20 days Exponential Moving Average is at 446, showing Sell signal, Bitcoin Cash is trading below it at $425.63. 20 days Simple Moving Average is indicating Sell since Bitcoin Cash is trading at $425.63, below MAs value of 444.9. 30 days Simple Moving Average is indicating Sell action with value at 462.3, Bitcoin Cash is trading below it at $425.63.
20 days Volume Weighted Moving Average is indicating Sell action with value at 451.3, Bitcoin Cash is trading below it at $425.63. 9 days Hull Moving Average is indicating Buy since Bitcoin Cash is trading at $425.63, below MAs value of 422.3. 30 days Exponential Moving Average is indicating Sell since Bitcoin Cash is trading at $425.63, below MAs value of 456.5.
Also Read: Cryptocurrency Mining Pools
50 days Simple Moving Average is indicating Sell action with value at 472.2, Bitcoin Cash is trading below it at $425.63. 10 days Simple Moving Average is indicating Sell since Bitcoin Cash is trading at $425.63, below MAs value of 434.2. 200 days Simple Moving Average is indicating Sell since Bitcoin Cash is trading at $425.63, below MAs value of 785.
Other Technical Price Analysis for today:
Bitcoin Price Looks Ready To Resume Its Climb - Bitcoin Price Analysis - 2 Nov 2018
Cardano Price May Move Towards $0.0750 - Bitcoin Price Analysis - 2 Nov 2018

