


Technical analysis is done by analyzing data gathered from historical trading activity, such as volume, price movement, open, close etc.
Bitcoin (BTC) Price Predictions / Bitcoin (BTC) Forecast
| After | Price | Change |
|---|---|---|
| 1 day | $6,738.6391 | 0.97% |
| 1 week | $6,701.5120 | 0.41% |
| 1 month | $6,433.7716 | -3.60% |
| 6 months | $7,127.4362 | 6.79% |
| 1 year | $9,560.3556 | 43.25% |
| 5 years | $23,612.4081 | 253.80% |
We've applied Technical Analysis to the price of Bitcoin (BTC/USD) for today and predict where price is headed.
The Stochastic Oscillator is a range bound momentum oscillator. Stochastic oscillator is showing Neutral signal, with value at 60.2.
The Relative Strength Index (RSI) is an important indicator for measuring the speed and variation of price movements. Its value ranges from zero and 100. The value around 30 and below is considered an oversold region and over 70 as oversold regions. Relative Strength Index is indicating Neutral action, with value at 49.5.
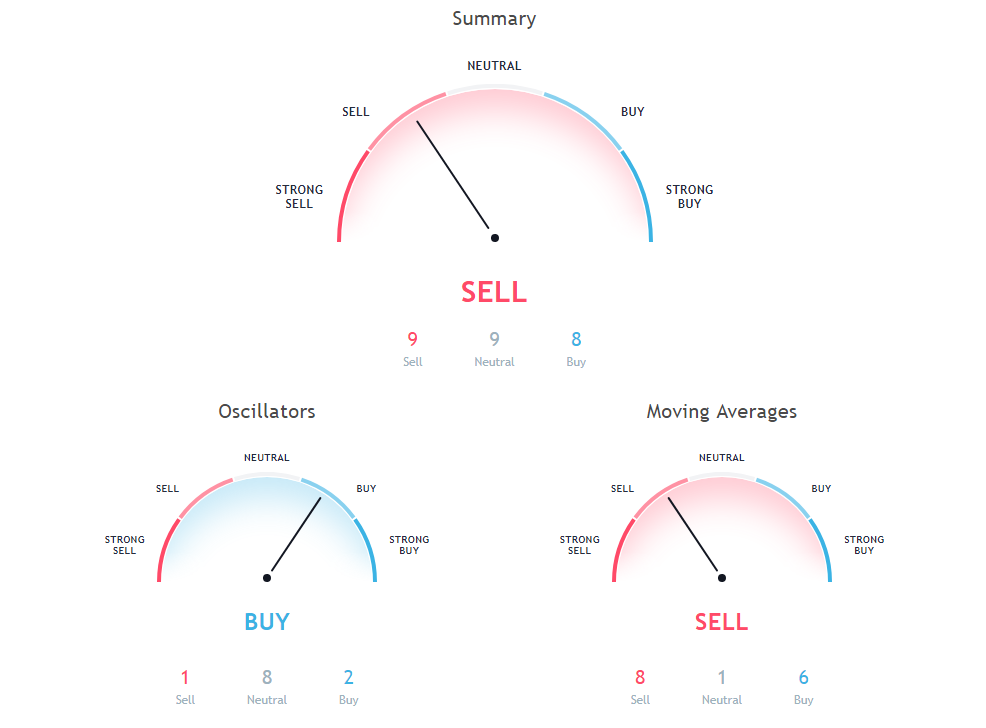
The Commodity Channel Index (CCI) is a momentum-based technical trading tool used to determine when a market is overbought or oversold. Commodity Channel Index is indicating Neutral action, with value at 35.2.
Moving Average (MA) in simple term is just average of any subset of numbers. For example, 50 Days simple moving average is calculated at any point in chart by summing past 50 days of price and then dividing it by 50.
50 days Exponential Moving Average is indicating Sell since Bitcoin is trading at $6674.01, below MAs value of 6854.4. 20 days Volume Weighted Moving Average is indicating Buy action with value at 6472.3, Bitcoin is trading below it at $6674.01. 30 days Simple Moving Average is indicating Sell action with value at 7024.1, Bitcoin is trading below it at $6674.01.
10 days Simple Moving Average is at 6389, showing Buy signal, Bitcoin is trading below it at $6674.01. 100 days Exponential Moving Average is indicating Sell action with value at 7193.5, Bitcoin is trading below it at $6674.01. 9 days Ichimoku Cloud Base Line is indicating Neutral since Bitcoin is trading at $6674.01, below MAs value of 7086.
10 days Exponential Moving Average is indicating Buy action with value at 6474.3, Bitcoin is trading below it at $6674.01. 100 days Simple Moving Average is at 7024.3, showing Sell signal, Bitcoin is trading below it at $6674.01. 9 days Hull Moving Average is indicating Buy since Bitcoin is trading at $6674.01, below MAs value of 6488.4.
Also Read: Best Bitcoin Cloud Mining Platforms of 2018
200 days Simple Moving Average is indicating Sell since Bitcoin is trading at $6674.01, below MAs value of 7928.1. 30 days Exponential Moving Average is indicating Sell action with value at 6720.4, Bitcoin is trading below it at $6674.01. 20 days Simple Moving Average is indicating Buy action with value at 6525.9, Bitcoin is trading below it at $6674.01.
200 days Exponential Moving Average is at 7628.9, showing Sell signal, Bitcoin is trading below it at $6674.01. 20 days Exponential Moving Average is at 6609.8, showing Buy signal, Bitcoin is trading below it at $6674.01. 50 days Simple Moving Average is indicating Sell since Bitcoin is trading at $6674.01, below MAs value of 6941.6.
Other Technical Price Analysis for today:
Ripple (XRP/USD) Price Prediction via Technical Analysis for 22 August 2018
NEO (NEO/USD) Price Prediction via Technical Analysis for 22 August 2018
Ethereum (ETH/USD) Price Prediction via Technical Analysis for 22 August 2018

