


Bitcoin (BTC) Price Predictions / Bitcoin (BTC) Forecast
| After | Price | Change |
|---|---|---|
| 1 day | $6,480.8106 | 0.34% |
| 1 week | $6,515.9492 | 0.88% |
| 1 month | $6,497.1430 | 0.59% |
| 6 months | $7,041.3674 | 9.01% |
| 1 year | $9,345.4209 | 44.69% |
| 5 years | $24,087.3697 | 272.92% |
The Relative Strength Index (RSI) is an important indicator for measuring the speed and variation of price movements. Its value ranges from zero and 100. The value around 30 and below is considered an oversold region and over 70 as oversold regions. Relative Strength Index is indicating Neutral action, with value at 49.
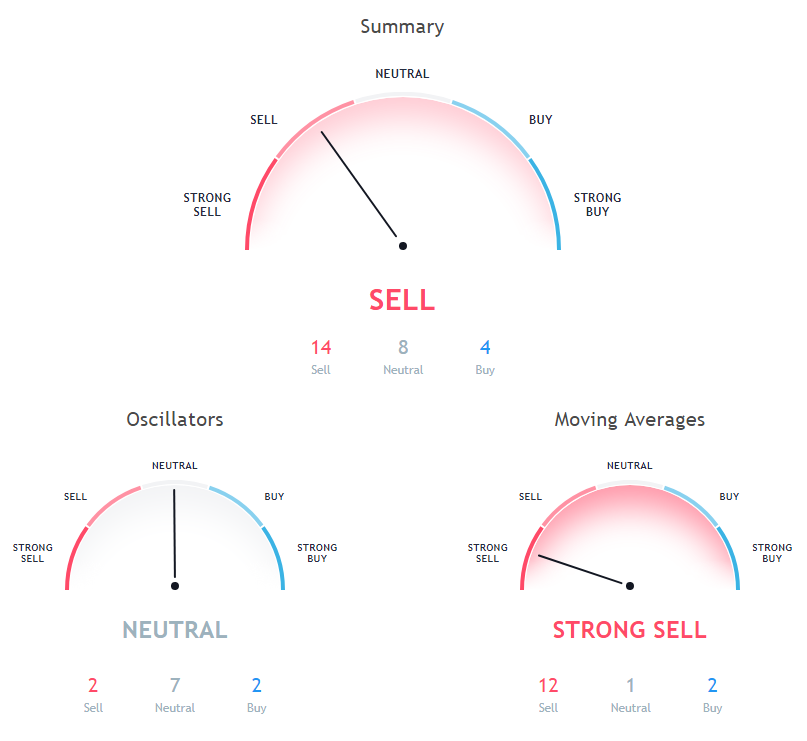
The Commodity Channel Index (CCI) is a momentum-based technical trading tool used to determine when a market is overbought or oversold. Commodity Channel Index is at -8.1, indicating Neutral action.
The stochastic oscillator is a momentum indicator that compares the closing price of a security with the price range over a specific period. Stochastic oscillator is indicating Neutral action, with value at 22.3.
Moving averages come in many forms, but their use remains the same: to help traders identify the trends of assets by smoothing out the day-to-day price fluctuations.
100 days Simple Moving Average is at 6795.5, showing Sell signal, Bitcoin is trading below it at $6459.09. 50 days Exponential Moving Average is indicating Sell action with value at 6599.2, Bitcoin is trading below it at $6459.09. 20 days Volume Weighted Moving Average is at 6581.2, showing Sell signal, Bitcoin is trading below it at $6459.09.
10 days Exponential Moving Average is indicating Sell since Bitcoin is trading at $6459.09, below MAs value of 6572.3. 20 days Simple Moving Average is indicating Sell since Bitcoin is trading at $6459.09, below MAs value of 6563.4. 10 days Simple Moving Average is indicating Sell action with value at 6599.7, Bitcoin is trading below it at $6459.09.
100 days Exponential Moving Average is indicating Sell since Bitcoin is trading at $6459.09, below MAs value of 6764.8. 20 days Exponential Moving Average is at 6567.3, showing Sell signal, Bitcoin is trading below it at $6459.09. 50 days Simple Moving Average is indicating Buy since Bitcoin is trading at $6459.09, below MAs value of 6538.5.
9 days Ichimoku Cloud Base Line is indicating Neutral action with value at 7004.2, Bitcoin is trading below it at $6459.09. 30 days Simple Moving Average is indicating Sell since Bitcoin is trading at $6459.09, below MAs value of 6564.6. 9 days Hull Moving Average is indicating Buy since Bitcoin is trading at $6459.09, below MAs value of 6542.8.
Also Read: Best Bitcoin Debit Cards of 2018
30 days Exponential Moving Average is indicating Sell since Bitcoin is trading at $6459.09, below MAs value of 6570.6. 200 days Exponential Moving Average is indicating Sell action with value at 7153.9, Bitcoin is trading below it at $6459.09. 200 days Simple Moving Average is indicating Sell action with value at 7200.7, Bitcoin is trading below it at $6459.09.
Other Technical Price Analysis for today:
EOS (EOS) Could Be Prime For A Triangle Breakout Soon - EOS Price Analysis - 23 Oct 2018

