


Bitcoin (BTC) Price Predictions / Bitcoin (BTC) Forecast
| After | Price | Change |
|---|---|---|
| 1 day | $6,484.7946 | 0.53% |
| 1 week | $6,553.3270 | 1.60% |
| 1 month | $6,438.1350 | -0.19% |
| 6 months | $6,995.1263 | 8.45% |
| 1 year | $9,400.7643 | 45.74% |
| 5 years | $23,838.1967 | 269.57% |
We've applied Technical Analysis to the price of Bitcoin (BTC/USD) for today and predict where price is headed.
The Commodity Channel Index (CCI) is a momentum-based technical trading tool used to determine when a market is overbought or oversold. Commodity Channel Index is indicating Neutral action, with value at -30.4.
The Relative Strength Index (RSI) is an important indicator for measuring the speed and variation of price movements. Its value ranges from zero and 100. The value around 30 and below is considered an oversold region and over 70 as oversold regions. Relative Strength Index is at 46.1, indicating Neutral action.
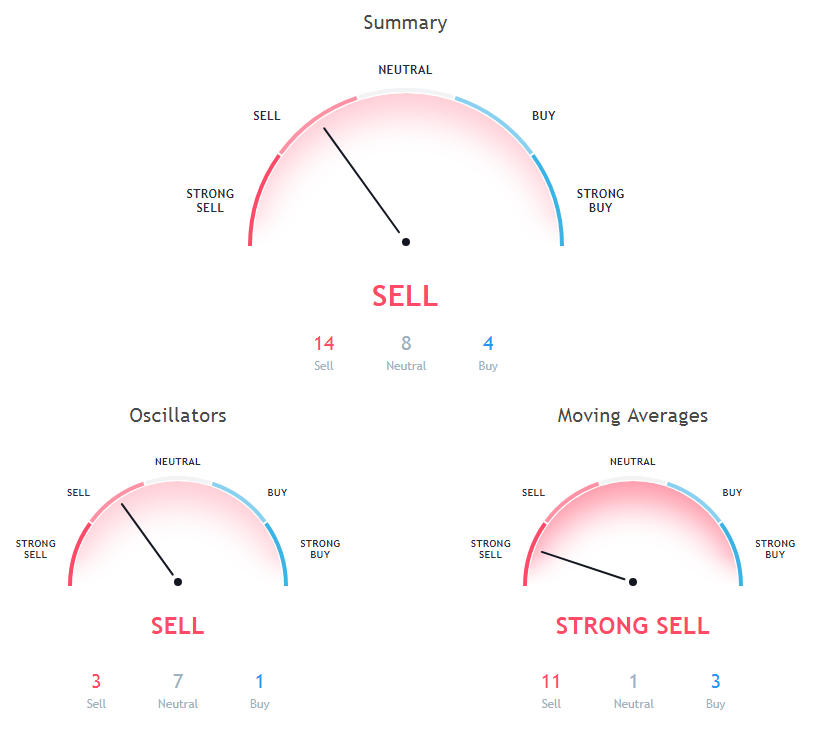
The stochastic oscillator is a momentum indicator that compares the closing price of a security with the price range over a specific period. Stochastic oscillator is indicating Neutral action, with value at 43.8.
Moving Average (MA) in simple term is just average of any subset of numbers. For example, 50 Days simple moving average is calculated at any point in chart by summing past 50 days of price and then dividing it by 50.
50 days Exponential Moving Average is indicating Sell action with value at 6670, Bitcoin is trading below it at $6450.29. 30 days Exponential Moving Average is indicating Sell action with value at 6569.4, Bitcoin is trading below it at $6450.29. 10 days Exponential Moving Average is indicating Buy action with value at 6424.7, Bitcoin is trading below it at $6450.29.
200 days Simple Moving Average is indicating Sell since Bitcoin is trading at $6450.29, below MAs value of 7489.5. 100 days Exponential Moving Average is indicating Sell action with value at 6940.6, Bitcoin is trading below it at $6450.29. 200 days Exponential Moving Average is at 7378.7, showing Sell signal, Bitcoin is trading below it at $6450.29.
50 days Simple Moving Average is indicating Sell action with value at 6618.8, Bitcoin is trading below it at $6450.29. 20 days Exponential Moving Average is at 6505.2, showing Sell signal, Bitcoin is trading below it at $6450.29. 100 days Simple Moving Average is indicating Sell action with value at 6738.5, Bitcoin is trading below it at $6450.29.
30 days Simple Moving Average is indicating Sell action with value at 6651.9, Bitcoin is trading below it at $6450.29. 20 days Simple Moving Average is indicating Sell action with value at 6575.2, Bitcoin is trading below it at $6450.29. 20 days Volume Weighted Moving Average is at 6640.5, showing Sell signal, Bitcoin is trading below it at $6450.29.
Also Read: What is Bitcoin Exchange?
9 days Ichimoku Cloud Base Line is indicating Neutral action with value at 6764.6, Bitcoin is trading below it at $6450.29. 9 days Hull Moving Average is indicating Buy since Bitcoin is trading at $6450.29, below MAs value of 6343. 10 days Simple Moving Average is indicating Buy since Bitcoin is trading at $6450.29, below MAs value of 6402.3.
Other Technical Price Analysis for today:
EOS (EOS/USD) Price Prediction via Technical Analysis for 20 September 2018
Ripple (XRP/USD) Price Prediction via Technical Analysis for 20 September 2018

