


Bitcoin (BTC) Price Predictions / Bitcoin (BTC) Forecast
| After | Price | Change |
|---|---|---|
| 1 day | $6,437.4262 | 0.66% |
| 1 week | $6,501.9611 | 1.67% |
| 1 month | $6,548.4524 | 2.40% |
| 6 months | $7,113.2471 | 11.23% |
| 1 year | $9,617.2172 | 50.39% |
| 5 years | $23,885.2784 | 273.50% |
We've applied Technical Analysis to the price of Bitcoin (BTC/USD) for today and predict where price is headed.
The Stochastic Oscillator is a range bound momentum oscillator. Stochastic oscillator is indicating Neutral action, with value at 19.6.
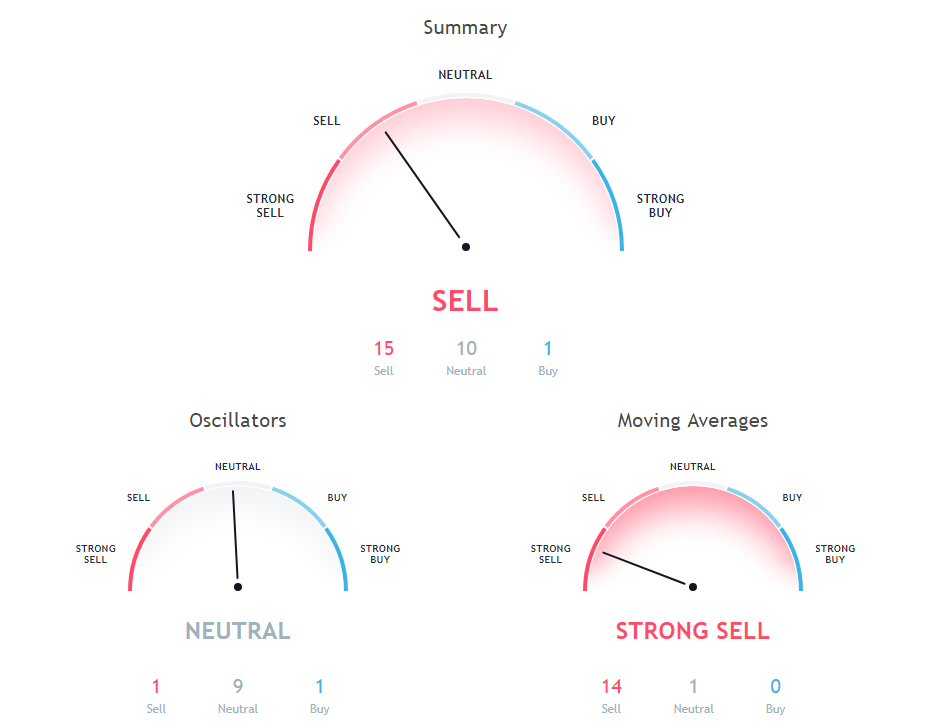
The Commodity Channel Index (CCI) is a momentum-based technical trading tool used to determine when a market is overbought or oversold. Commodity Channel Index is showing Neutral signal, with value at -94.7.
Relative Strength Index (RSI) is an important indicator that measures speed and change of price movements. Its value ranges between zero and 100. Value around 30 and below is considered oversold region and around 70 and above considered overbought regions. Relative Strength Index is showing Neutral signal, with value at 39.3.
200 days Simple Moving Average is indicating Sell since Bitcoin is trading at $6395, below MAs value of 7760.6. 50 days Exponential Moving Average is at 6871.3, showing Sell signal, Bitcoin is trading below it at $6395. 20 days Exponential Moving Average is indicating Sell action with value at 6830.7, Bitcoin is trading below it at $6395.
9 days Ichimoku Cloud Base Line is indicating Neutral since Bitcoin is trading at $6395, below MAs value of 6643.9. 20 days Volume Weighted Moving Average is indicating Sell since Bitcoin is trading at $6395, below MAs value of 6772.1. 30 days Simple Moving Average is indicating Sell action with value at 6640.9, Bitcoin is trading below it at $6395.
20 days Simple Moving Average is indicating Sell action with value at 6799.9, Bitcoin is trading below it at $6395. 200 days Exponential Moving Average is indicating Sell since Bitcoin is trading at $6395, below MAs value of 7518.8. 100 days Exponential Moving Average is indicating Sell since Bitcoin is trading at $6395, below MAs value of 7109.6.
10 days Simple Moving Average is indicating Sell action with value at 6976.4, Bitcoin is trading below it at $6395. 9 days Hull Moving Average is indicating Sell action with value at 6537.7, Bitcoin is trading below it at $6395. 50 days Simple Moving Average is indicating Sell action with value at 7013.7, Bitcoin is trading below it at $6395.
Also Read: Cryptocurrency Do's and Don'ts
100 days Simple Moving Average is indicating Sell action with value at 6871.7, Bitcoin is trading below it at $6395. 30 days Exponential Moving Average is at 6832.3, showing Sell signal, Bitcoin is trading below it at $6395. 10 days Exponential Moving Average is indicating Sell since Bitcoin is trading at $6395, below MAs value of 6829.7.
Other Technical Price Analysis for today:
EOS (EOS/USD) Price Prediction via Technical Analysis for 07 September 2018
Stellar (XLM/USD) Price Prediction via Technical Analysis for 07 September 2018
Litecoin (LTC/USD) Price Prediction via Technical Analysis for 07 September 2018

