


ZCash (ZEC) Price Predictions / ZCash (ZEC) Forecast
| After | Price | Change |
|---|---|---|
| 1 day | $115.4488 | 0.44% |
| 1 week | $116.6451 | 1.48% |
| 1 month | $120.7938 | 5.09% |
| 6 months | $154.4840 | 34.40% |
| 1 year | $250.6521 | 118.07% |
| 5 years | $1,538.0227 | 1,238.11% |
We've applied Technical Analysis to the price of ZCash (ZEC/USD) for today and predict where price is headed.
The stochastic oscillator is a momentum indicator that compares the closing price of a security with the price range over a specific period. Stochastic oscillator is indicating Neutral action, with value at 33.3.
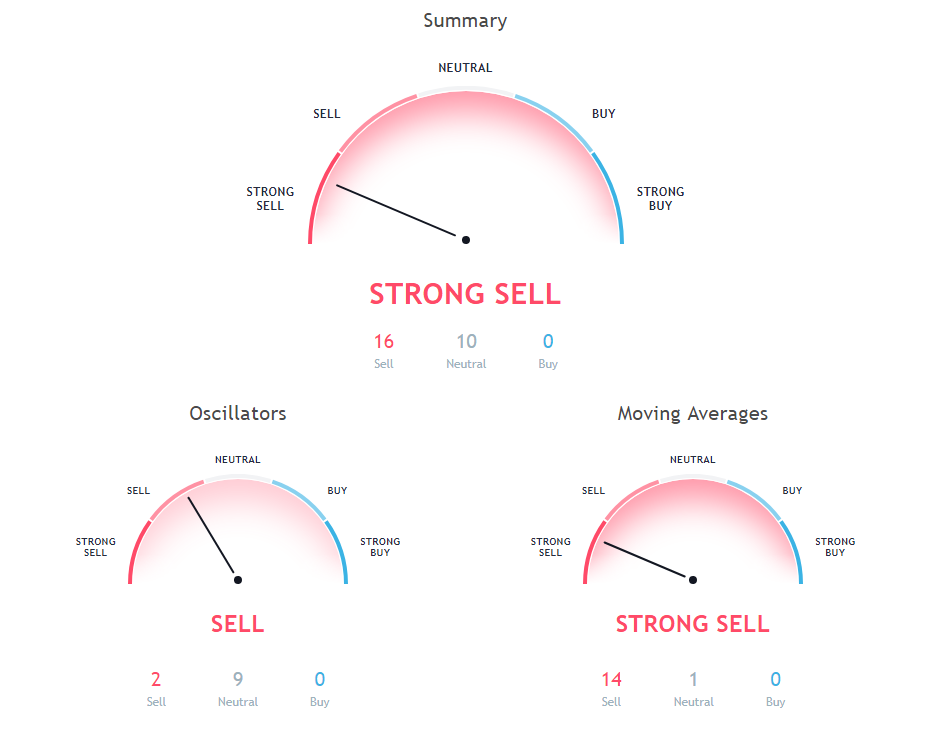
The Commodity Channel Index (CCI) is a momentum-based technical trading tool used to determine when a market is overbought or oversold. Commodity Channel Index is at -73.29, indicating Neutral action.
The Relative Strength Index (RSI) is an important indicator for measuring the speed and variation of price movements. Its value ranges from zero and 100. The value around 30 and below is considered an oversold region and over 70 as oversold regions. Relative Strength Index is at 34.68, indicating Neutral action.
Moving averages come in many forms, but their use remains the same: to help traders identify the trends of assets by smoothing out the day-to-day price fluctuations.
9 days Hull Moving Average is at 119.26, showing Sell signal, ZCash is trading below it at $114.94. 50 days Simple Moving Average is at 147.66, showing Sell signal, ZCash is trading below it at $114.94. 50 days Exponential Moving Average is at 145.77, showing Sell signal, ZCash is trading below it at $114.94.
30 days Exponential Moving Average is indicating Sell since ZCash is trading at $114.94, below MAs value of 134.18. 20 days Simple Moving Average is indicating Sell action with value at 132.04, ZCash is trading below it at $114.94. 9 days Ichimoku Cloud Base Line is indicating Neutral action with value at 129.21, ZCash is trading below it at $114.94.
200 days Exponential Moving Average is indicating Sell action with value at 213.41, ZCash is trading below it at $114.94. 20 days Volume Weighted Moving Average is indicating Sell action with value at 132.93, ZCash is trading below it at $114.94. 200 days Simple Moving Average is at 215.62, showing Sell signal, ZCash is trading below it at $114.94.
30 days Simple Moving Average is indicating Sell action with value at 134.21, ZCash is trading below it at $114.94. 20 days Exponential Moving Average is at 127.7, showing Sell signal, ZCash is trading below it at $114.94. 10 days Simple Moving Average is indicating Sell action with value at 117.27, ZCash is trading below it at $114.94.
Also Read: Beginners Guide to Binance Cryptocurrency Exchange
10 days Exponential Moving Average is indicating Sell action with value at 120.48, ZCash is trading below it at $114.94. 100 days Exponential Moving Average is indicating Sell since ZCash is trading at $114.94, below MAs value of 172.35. 100 days Simple Moving Average is at 166.67, showing Sell signal, ZCash is trading below it at $114.94.
Other Technical Price Analysis for today:
Bitcoin (BTC/USD) Price Prediction via Technical Analysis for 17 September 2018
Bitcoin Cash (BCH/USD) Price Prediction via Technical Analysis for 17 September 2018
DigitalCash (DASH/USD) Price Prediction via Technical Analysis for 17 September 2018

