


Ripple (XRP) Price Predictions / Ripple (XRP) Forecast
| After | Price | Change |
|---|---|---|
| 1 day | $0.3753 | 0.35% |
| 1 week | $0.3759 | 0.52% |
| 1 month | $0.3841 | 2.69% |
| 6 months | $0.4345 | 16.16% |
| 1 year | $0.8146 | 117.82% |
| 5 years | $2.1976 | 487.58% |
The Stochastic Oscillator is a range bound momentum oscillator. Stochastic oscillator is showing Neutral signal, with value at 27.6.
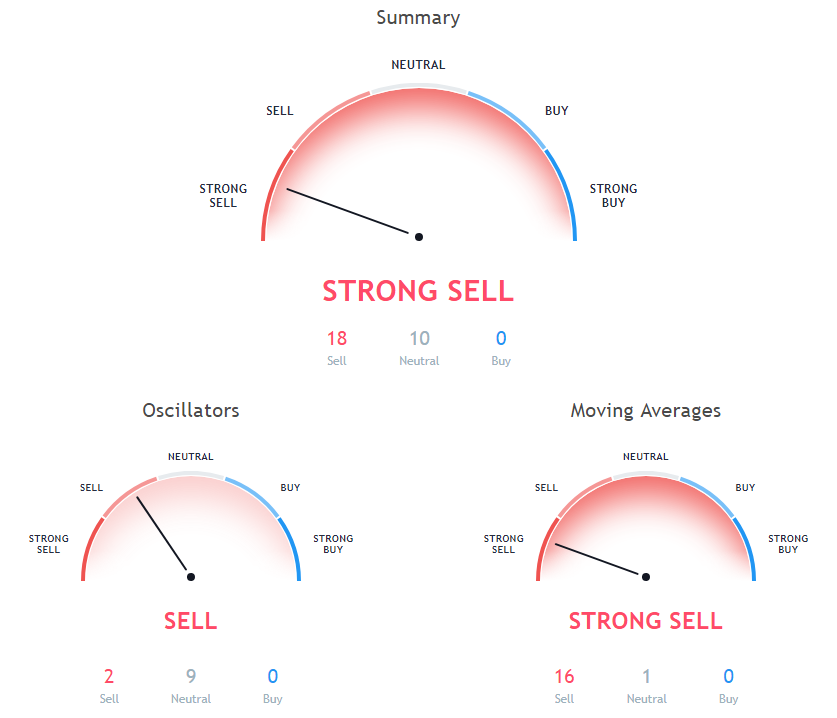
The Commodity Channel Index (CCI) is a momentum oscillator used in technical analysis to measure an instrument's deviation from its statistical average. Commodity Channel Index is at -89.01, indicating Neutral action.
Relative Strength Index (RSI) is an important indicator that measures speed and change of price movements. Its value ranges between zero and 100. Value around 30 and below is considered oversold region and around 70 and above considered overbought regions. Relative Strength Index is at 35.97, indicating Neutral action.
Moving averages come in many forms, but their use remains the same: to help traders identify the trends of assets by smoothing out the day-to-day price fluctuations.
9 days Ichimoku Cloud Base Line is indicating Neutral action with value at 0.45, Ripple is trading below it at $0.374. 100 days Exponential Moving Average is at 0.45, showing Sell signal, Ripple is trading below it at $0.374. 50 days Exponential Moving Average is at 0.45, showing Sell signal, Ripple is trading below it at $0.374.
10 days Exponential Moving Average is at 0.4, showing Sell signal, Ripple is trading below it at $0.374. 30 days Exponential Moving Average is at 0.44, showing Sell signal, Ripple is trading below it at $0.374. 30 days Simple Moving Average is indicating Sell since Ripple is trading at $0.374, below MAs value of 0.46.
10 days Simple Moving Average is indicating Sell action with value at 0.39, Ripple is trading below it at $0.374. 5 days Exponential Moving Average is indicating Sell action with value at 0.38, Ripple is trading below it at $0.374. 100 days Simple Moving Average is at 0.43, showing Sell signal, Ripple is trading below it at $0.374.
9 days Hull Moving Average is indicating Sell since Ripple is trading at $0.374, below MAs value of 0.38. 20 days Volume Weighted Moving Average is indicating Sell since Ripple is trading at $0.374, below MAs value of 0.44. 50 days Simple Moving Average is at 0.46, showing Sell signal, Ripple is trading below it at $0.374.
200 days Simple Moving Average is at 0.46, showing Sell signal, Ripple is trading below it at $0.374. 200 days Exponential Moving Average is indicating Sell action with value at 0.49, Ripple is trading below it at $0.374. 20 days Exponential Moving Average is indicating Sell action with value at 0.43, Ripple is trading below it at $0.374.
Also Read: 10 Best Ripple Wallets of 2018
5 days Simple Moving Average is indicating Sell action with value at 0.38, Ripple is trading below it at $0.374. 20 days Simple Moving Average is at 0.44, showing Sell signal, Ripple is trading below it at $0.374.
Other Technical Price Analysis for today:

