


Bitcoin (BTC) Price Predictions / Bitcoin (BTC) Forecast
| After | Price | Change |
|---|---|---|
| 1 day | $4,256.6482 | 0.93% |
| 1 week | $4,265.5698 | 1.14% |
| 1 month | $4,360.3046 | 3.38% |
| 6 months | $4,735.8162 | 12.29% |
| 1 year | $7,243.8707 | 71.76% |
| 5 years | $21,978.9795 | 421.13% |
The Relative Strength Index (RSI) is an important indicator for measuring the speed and variation of price movements. Its value ranges from zero and 100. The value around 30 and below is considered an oversold region and over 70 as oversold regions. Relative Strength Index is indicating Neutral action, with value at 30.4.
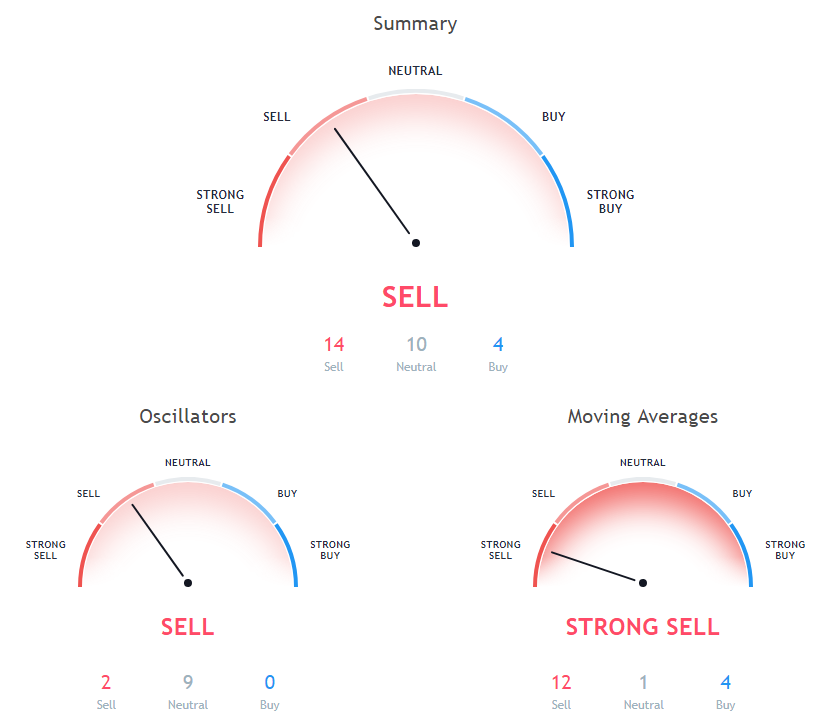
The stochastic oscillator is a momentum indicator that compares the closing price of a security with the price range over a specific period. Stochastic oscillator is showing Neutral signal, with value at 29.4.
The Commodity Channel Index (CCI) is a momentum oscillator used in technical analysis to measure an instrument's deviation from its statistical average. Commodity Channel Index is showing Neutral signal, with value at -59.3.
100 days Exponential Moving Average is indicating Sell since Bitcoin is trading at $4217.56, below MAs value of 6082.6. 200 days Simple Moving Average is at 6641.6, showing Sell signal, Bitcoin is trading below it at $4217.56. 20 days Exponential Moving Average is indicating Sell since Bitcoin is trading at $4217.56, below MAs value of 4824.
200 days Exponential Moving Average is indicating Sell action with value at 6657.1, Bitcoin is trading below it at $4217.56. 50 days Exponential Moving Average is indicating Sell since Bitcoin is trading at $4217.56, below MAs value of 5572.9. 10 days Exponential Moving Average is indicating Sell since Bitcoin is trading at $4217.56, below MAs value of 4373.1.
20 days Simple Moving Average is at 4978.2, showing Sell signal, Bitcoin is trading below it at $4217.56. 5 days Simple Moving Average is indicating Buy action with value at 4125.6, Bitcoin is trading below it at $4217.56. 100 days Simple Moving Average is indicating Sell since Bitcoin is trading at $4217.56, below MAs value of 6261.9.
9 days Hull Moving Average is indicating Buy since Bitcoin is trading at $4217.56, below MAs value of 4245.4. 9 days Ichimoku Cloud Base Line is indicating Neutral since Bitcoin is trading at $4217.56, below MAs value of 5136.3. 5 days Exponential Moving Average is indicating Buy action with value at 4222.2, Bitcoin is trading below it at $4217.56.
20 days Volume Weighted Moving Average is indicating Sell action with value at 4660.6, Bitcoin is trading below it at $4217.56. 10 days Simple Moving Average is indicating Buy since Bitcoin is trading at $4217.56, below MAs value of 4210.2. 30 days Simple Moving Average is at 5472.2, showing Sell signal, Bitcoin is trading below it at $4217.56.
Also Read: Best Ways to Buy Bitcoin with Western Union in 2018
30 days Exponential Moving Average is indicating Sell action with value at 5161, Bitcoin is trading below it at $4217.56. 50 days Simple Moving Average is indicating Sell since Bitcoin is trading at $4217.56, below MAs value of 5888.6.
Other Technical Price Analysis for today:
Ripple (XRP) Price Likely To See Gains Towards $0.4200 Level - Ripple Price Analysis - 30 Nov 2018

