


Ripple (XRP) Price Predictions / Ripple (XRP) Forecast
| After | Price | Change |
|---|---|---|
| 1 day | $0.4755 | 0.84% |
| 1 week | $0.4795 | 1.68% |
| 1 month | $0.4870 | 3.26% |
| 6 months | $0.5464 | 15.87% |
| 1 year | $0.9257 | 96.30% |
| 5 years | $2.3095 | 389.72% |
The Commodity Channel Index (CCI) is a momentum-based technical trading tool used to determine when a market is overbought or oversold. Commodity Channel Index is showing Neutral signal, with value at -36.41931.
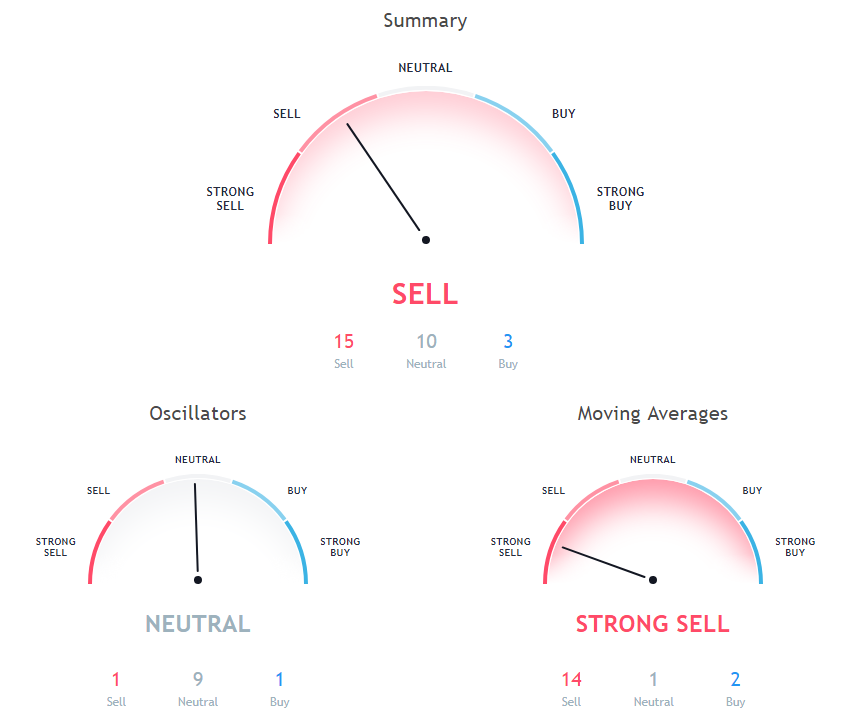
The Stochastic Oscillator is a range bound momentum oscillator. Stochastic oscillator is indicating Neutral action, with value at 43.57035.
The Relative Strength Index (RSI) is an important indicator for measuring the speed and variation of price movements. Its value ranges from zero and 100. The value around 30 and below is considered an oversold region and over 70 as oversold regions. Relative Strength Index is at 46.61483, indicating Neutral action.
5 days Simple Moving Average is indicating Sell action with value at 0.4979, Ripple is trading below it at $0.4716. 30 days Exponential Moving Average is at 0.48506, showing Sell signal, Ripple is trading below it at $0.4716. 20 days Simple Moving Average is at 0.48844, showing Sell signal, Ripple is trading below it at $0.4716.
9 days Hull Moving Average is at 0.48326, showing Sell signal, Ripple is trading below it at $0.4716. 30 days Simple Moving Average is indicating Sell since Ripple is trading at $0.4716, below MAs value of 0.48052. 100 days Exponential Moving Average is at 0.4632, showing Buy signal, Ripple is trading below it at $0.4716.
5 days Exponential Moving Average is indicating Sell since Ripple is trading at $0.4716, below MAs value of 0.49118. 10 days Exponential Moving Average is at 0.49585, showing Sell signal, Ripple is trading below it at $0.4716. 50 days Simple Moving Average is at 0.48514, showing Sell signal, Ripple is trading below it at $0.4716.
9 days Ichimoku Cloud Base Line is indicating Neutral action with value at 0.49265, Ripple is trading below it at $0.4716. 10 days Simple Moving Average is at 0.50512, showing Sell signal, Ripple is trading below it at $0.4716. 100 days Simple Moving Average is indicating Buy since Ripple is trading at $0.4716, below MAs value of 0.41484.
20 days Volume Weighted Moving Average is indicating Sell since Ripple is trading at $0.4716, below MAs value of 0.49934. 200 days Exponential Moving Average is at 0.49894, showing Sell signal, Ripple is trading below it at $0.4716. 200 days Simple Moving Average is indicating Sell action with value at 0.4896, Ripple is trading below it at $0.4716.
Also Read: Future of Cryptocurrencies
20 days Exponential Moving Average is indicating Sell since Ripple is trading at $0.4716, below MAs value of 0.49127. 50 days Exponential Moving Average is at 0.47238, showing Buy signal, Ripple is trading below it at $0.4716.
Other Technical Price Analysis for today:
Bitcoin (BTC) Prices May Find Support At $4,500 - Bitcoin Price Analysis - 16 Nov 2018
Ethereum (ETH) Price Could Go Above $180 - Ethereum Price Analysis - 16 Nov 2018

