


Bitcoin (BTC) Price Predictions / Bitcoin (BTC) Forecast
| After | Price | Change |
|---|---|---|
| 1 day | $5,570.8692 | 0.04% |
| 1 week | $5,584.3459 | 0.28% |
| 1 month | $5,652.4702 | 1.50% |
| 6 months | $5,965.5894 | 7.13% |
| 1 year | $8,520.3914 | 53.00% |
| 5 years | $23,347.5428 | 319.26% |
Relative Strength Index (RSI) is an important indicator that measures speed and change of price movements. Its value ranges between zero and 100. Value around 30 and below is considered oversold region and around 70 and above considered overbought regions. Relative Strength Index is indicating Buy action, with value at 19.3.
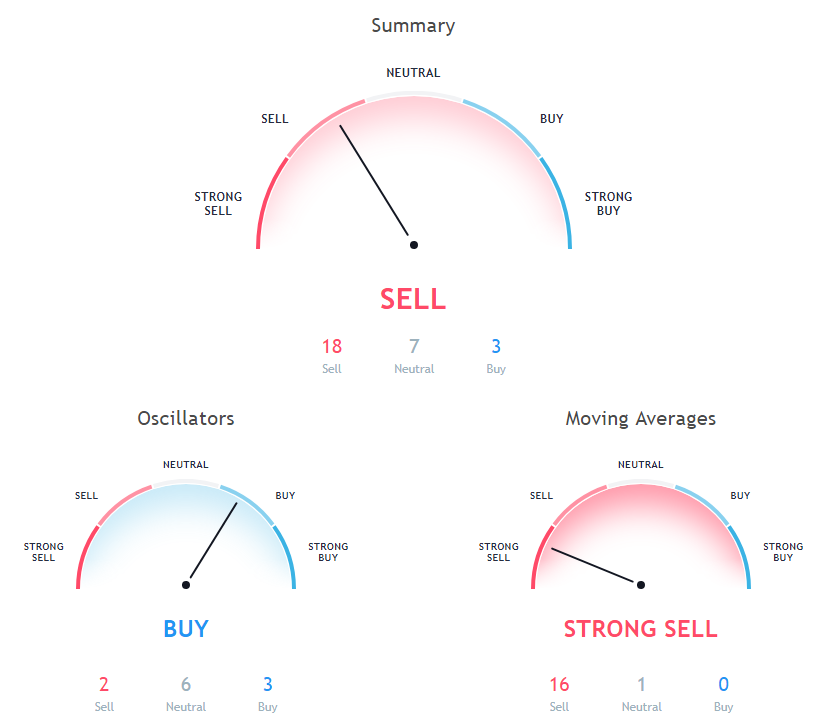
The Commodity Channel Index (CCI) is a momentum oscillator used in technical analysis to measure an instrument's deviation from its statistical average. Commodity Channel Index is showing Buy signal, with value at -276.2.
The stochastic oscillator is a momentum indicator that compares the closing price of a security with the price range over a specific period. Stochastic oscillator is showing Neutral signal, with value at 23.
20 days Volume Weighted Moving Average is at 6168.8, showing Sell signal, Bitcoin is trading below it at $5568.8. 9 days Hull Moving Average is indicating Sell since Bitcoin is trading at $5568.8, below MAs value of 5724. 20 days Exponential Moving Average is at 6283.9, showing Sell signal, Bitcoin is trading below it at $5568.8.
50 days Simple Moving Average is indicating Sell since Bitcoin is trading at $5568.8, below MAs value of 6473.1. 5 days Simple Moving Average is at 6039.8, showing Sell signal, Bitcoin is trading below it at $5568.8. 30 days Simple Moving Average is at 6410.9, showing Sell signal, Bitcoin is trading below it at $5568.8.
200 days Exponential Moving Average is indicating Sell since Bitcoin is trading at $5568.8, below MAs value of 6984.7. 100 days Exponential Moving Average is indicating Sell since Bitcoin is trading at $5568.8, below MAs value of 6606.9. 200 days Simple Moving Average is indicating Sell action with value at 6969.1, Bitcoin is trading below it at $5568.8.
9 days Ichimoku Cloud Base Line is at 6030, showing Neutral signal, Bitcoin is trading below it at $5568.8. 100 days Simple Moving Average is indicating Sell since Bitcoin is trading at $5568.8, below MAs value of 6520.9. 10 days Exponential Moving Average is indicating Sell since Bitcoin is trading at $5568.8, below MAs value of 6135.
20 days Simple Moving Average is indicating Sell action with value at 6339.3, Bitcoin is trading below it at $5568.8. 50 days Exponential Moving Average is at 6432.2, showing Sell signal, Bitcoin is trading below it at $5568.8. 10 days Simple Moving Average is indicating Sell since Bitcoin is trading at $5568.8, below MAs value of 6254.5.
Also Read: What is Bitcoin Mining? How to Mine Bitcoin?
30 days Exponential Moving Average is at 6352.4, showing Sell signal, Bitcoin is trading below it at $5568.8. 5 days Exponential Moving Average is at 5941, showing Sell signal, Bitcoin is trading below it at $5568.8.
Other Technical Price Analysis for today:
Ethereum (ETH) Price Could Go Above $180 - Ethereum Price Analysis - 16 Nov 2018

