


Monero (XMR) Price Predictions / Monero (XMR) Forecast
| After | Price | Change |
|---|---|---|
| 1 day | $112.4580 | 0.31% |
| 1 week | $112.7731 | 0.59% |
| 1 month | $113.5762 | 1.31% |
| 6 months | $142.1035 | 26.75% |
| 1 year | $203.8457 | 81.83% |
| 5 years | $586.8077 | 423.42% |
We've applied Technical Analysis to the price of Monero (XMR/USD) for today and predict where price is headed.
The Commodity Channel Index (CCI) is a momentum-based technical trading tool used to determine when a market is overbought or oversold. Commodity Channel Index is indicating Neutral action, with value at 2.835.
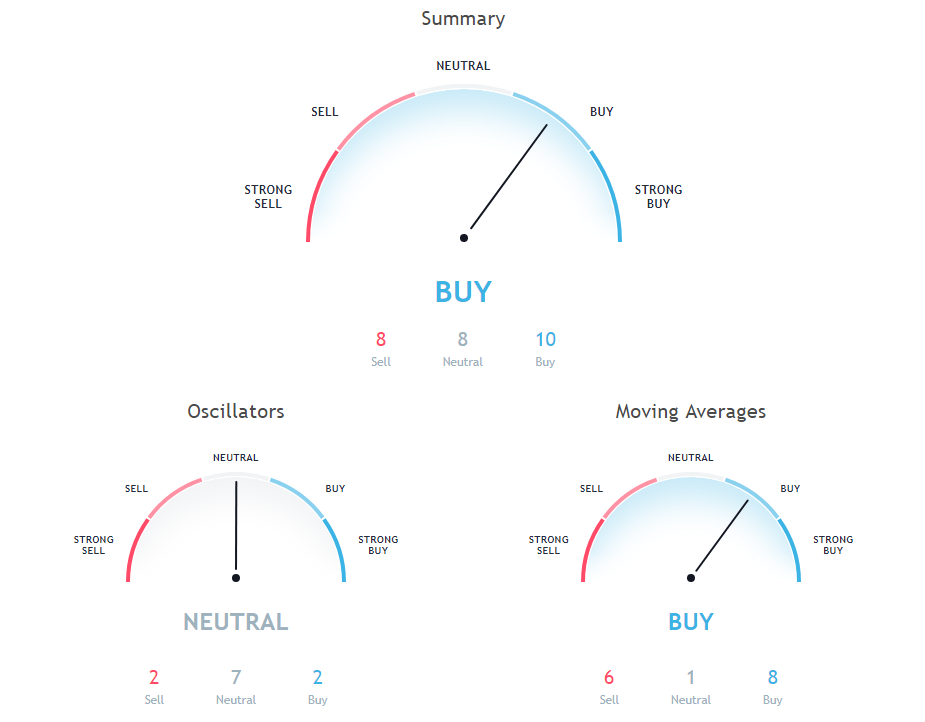
The Stochastic Oscillator is a range bound momentum oscillator. Stochastic oscillator is indicating Neutral action, with value at 28.303.
Relative Strength Index (RSI) is an important indicator that measures speed and change of price movements. Its value ranges between zero and 100. Value around 30 and below is considered oversold region and around 70 and above considered overbought regions. Relative Strength Index is showing Neutral signal, with value at 52.301.
Moving Average (MA) is just average of any subset of numbers. For example, to calculate a basic 10-day moving average you would add up the closing prices from the past 10 days and then divide the result by 10.
10 days Simple Moving Average is indicating Buy since Monero is trading at $112.11, below MAs value of 109.154. 200 days Exponential Moving Average is indicating Sell since Monero is trading at $112.11, below MAs value of 151.597. 200 days Simple Moving Average is indicating Sell action with value at 169.059, Monero is trading below it at $112.11.
30 days Simple Moving Average is indicating Buy since Monero is trading at $112.11, below MAs value of 105.908. 9 days Ichimoku Cloud Base Line is indicating Neutral since Monero is trading at $112.11, below MAs value of 115.046. 20 days Volume Weighted Moving Average is indicating Sell action with value at 116.703, Monero is trading below it at $112.11.
9 days Hull Moving Average is indicating Buy since Monero is trading at $112.11, below MAs value of 108.853. 30 days Exponential Moving Average is indicating Buy action with value at 109.48, Monero is trading below it at $112.11. 100 days Simple Moving Average is indicating Sell action with value at 119.704, Monero is trading below it at $112.11.
50 days Simple Moving Average is at 108.085, showing Buy signal, Monero is trading below it at $112.11. 50 days Exponential Moving Average is indicating Sell action with value at 112.271, Monero is trading below it at $112.11. 10 days Exponential Moving Average is indicating Buy since Monero is trading at $112.11, below MAs value of 110.031.
Also Read: Best Cryptocurrency To Invest in 2018 with Detailed Analysis
20 days Simple Moving Average is indicating Buy action with value at 111.807, Monero is trading below it at $112.11. 100 days Exponential Moving Average is indicating Sell since Monero is trading at $112.11, below MAs value of 127.382. 20 days Exponential Moving Average is indicating Buy action with value at 109.574, Monero is trading below it at $112.11.
Other Technical Price Analysis for today:
Ethereum (ETH/USD) Price Prediction via Technical Analysis for 14 September 2018

