


We're going to apply Technical Analysis to IOTA Price, and predict where the IOTA price is most likely headed.
IOTA has been in the downtrend for a couple of months now. And recent news that Sirin Labs dropped the plans to build blockchain smartphone on IOTA's technology caused more than 18% drop on IOTA Price.
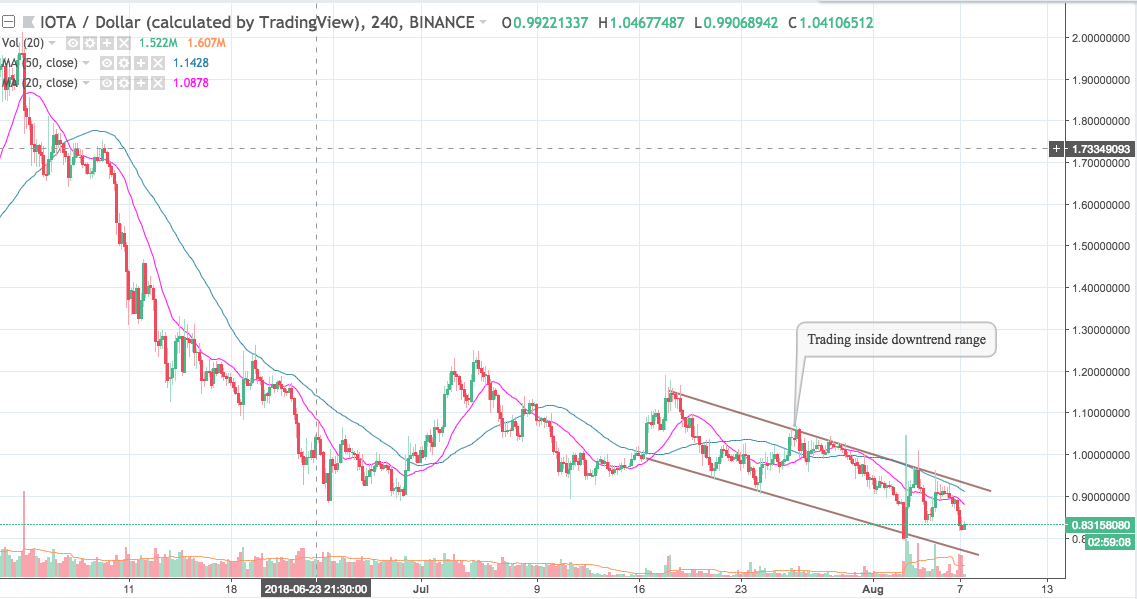
Trading inside downtrend range for 4-hour chart
As shown in the chart below, IOTA has been trading inside a downtrend range for 20 days and has again started testing it's lower trend line. Continuously trading inside the downtrend shows that bears are in complete control right now.
IOTA is also trading below its 50 days Moving Average and 20 days Moving Average.
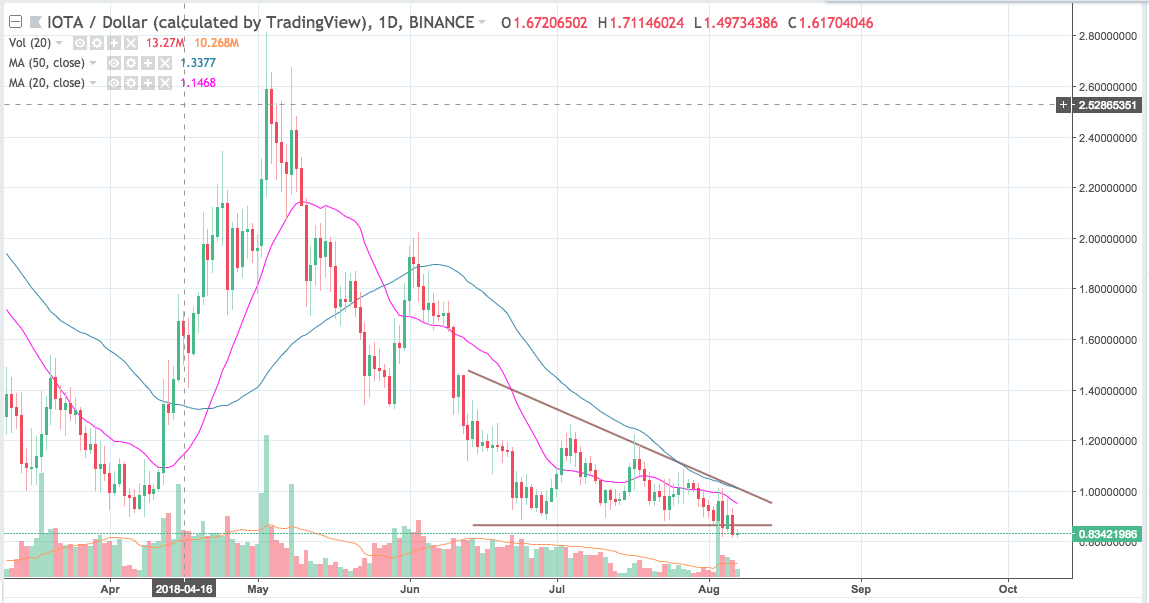
Descending Triangle is Breaking down
As below chart shows, IOTA has broken the Descending Triangle after the news of Sirin Labs. Bears have been able to cut the Descending Triangle with a drop of more than 18%. This breakdown means that IOTA can be headed lower.
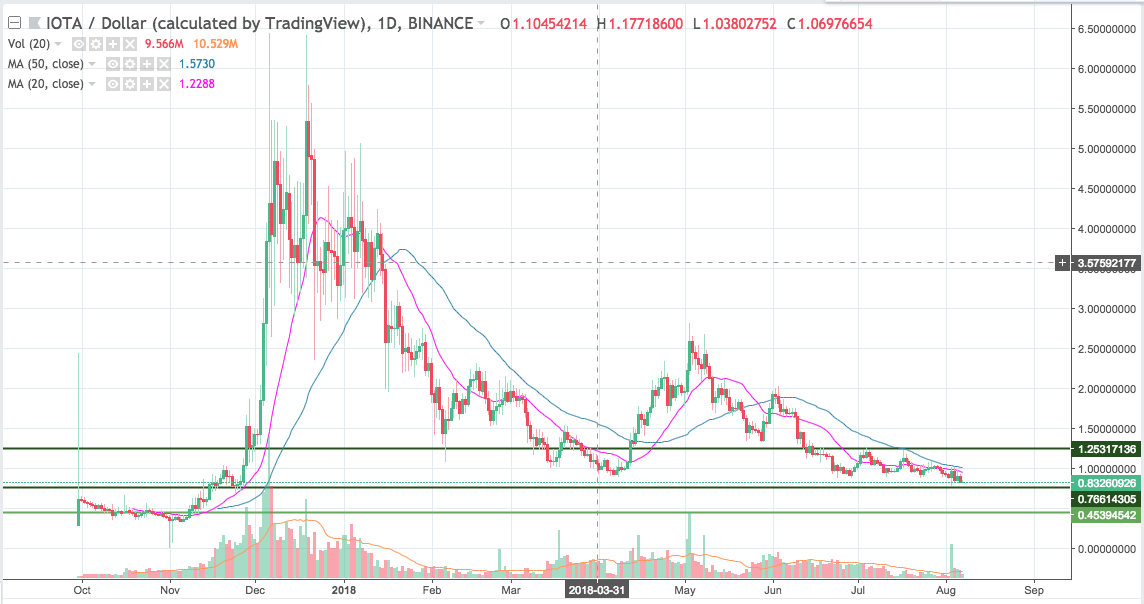
Bulls should be cautious before going long
IOTA downward momentum is getting strong with the breakdown of the Descending Triangle Pattern. It can head lower to levels of 0.45 in coming weeks. Bulls should be careful before initiating fresh long positions as long as IOTA trades below strong resistance at 1.25. Trades can go long once IOTA is above 1.25 and sustains there, with the first target of 1.55 and a second target of 1.9, with StopLoss at 0.95. Risk reward for the trades will be 1:1 and 1:2.
Disclaimer: Views and opinions expressed are those of the author and aren’t investment advice. Trading of any form involves risk and so do your due diligence before making a trading decision.

