


Bitcoin (BTC) Price Predictions / Bitcoin (BTC) Forecast
| After | Price | Change |
|---|---|---|
| 1 day | $6,678.5478 | 0.67% |
| 1 week | $6,653.8670 | 0.30% |
| 1 month | $6,268.5182 | -5.51% |
| 6 months | $6,852.0633 | 3.29% |
| 1 year | $9,127.9484 | 37.59% |
| 5 years | $23,813.6618 | 258.96% |
The Commodity Channel Index (CCI) is a momentum-based technical trading tool used to determine when a market is overbought or oversold. Commodity Channel Index is indicating Neutral action, with value at 152.3.
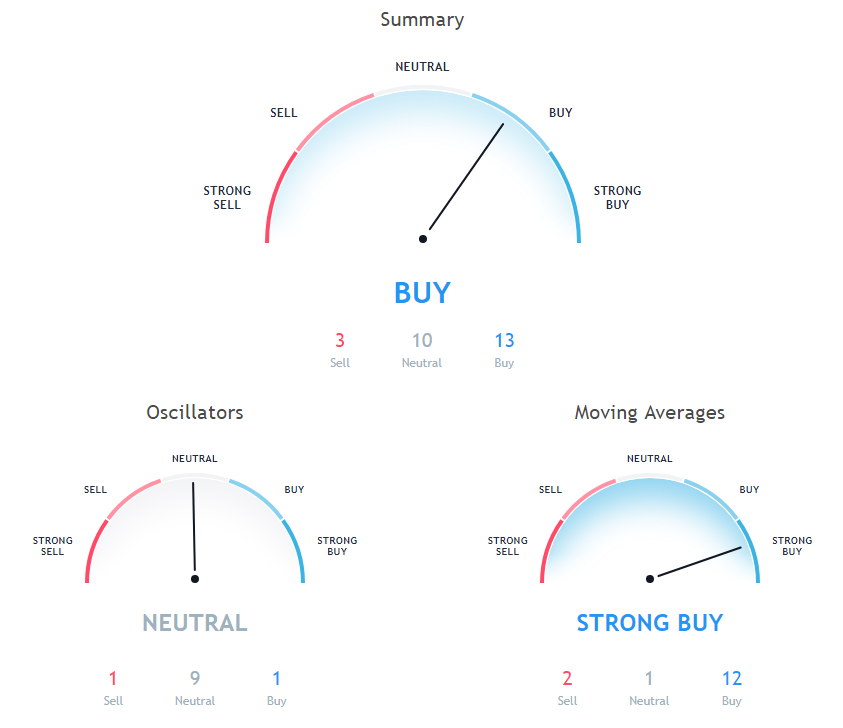
Relative Strength Index (RSI) is an important indicator that measures speed and change of price movements. Its value ranges between zero and 100. Value around 30 and below is considered oversold region and around 70 and above considered overbought regions. Relative Strength Index is showing Neutral signal, with value at 59.9.
The Stochastic Oscillator is a range bound momentum oscillator. Stochastic oscillator is indicating Neutral action, with value at 27.
Moving Average (MA) in simple term is just average of any subset of numbers. For example, 50 Days simple moving average is calculated at any point in chart by summing past 50 days of price and then dividing it by 50.
10 days Exponential Moving Average is at 6515.3, showing Buy signal, Bitcoin is trading below it at $6633.99. 9 days Hull Moving Average is indicating Buy since Bitcoin is trading at $6633.99, below MAs value of 6387.3. 50 days Simple Moving Average is indicating Buy since Bitcoin is trading at $6633.99, below MAs value of 6617.6.
10 days Simple Moving Average is indicating Buy since Bitcoin is trading at $6633.99, below MAs value of 6519.9. 50 days Exponential Moving Average is at 6598.5, showing Buy signal, Bitcoin is trading below it at $6633.99. 20 days Volume Weighted Moving Average is indicating Buy action with value at 6572.9, Bitcoin is trading below it at $6633.99.
200 days Simple Moving Average is at 7212.5, showing Sell signal, Bitcoin is trading below it at $6633.99. 9 days Ichimoku Cloud Base Line is indicating Neutral since Bitcoin is trading at $6633.99, below MAs value of 7004.2. 20 days Simple Moving Average is indicating Buy since Bitcoin is trading at $6633.99, below MAs value of 6553.5.
100 days Exponential Moving Average is at 6792.9, showing Buy signal, Bitcoin is trading below it at $6633.99. 100 days Simple Moving Average is indicating Buy since Bitcoin is trading at $6633.99, below MAs value of 6778.3. 20 days Exponential Moving Average is indicating Buy since Bitcoin is trading at $6633.99, below MAs value of 6533.
Also Read: Ledger Nano S vs Trezor vs KeepKey: A Complete Cryptocurrency Hardware Wallet Comparison
30 days Simple Moving Average is indicating Buy action with value at 6542.1, Bitcoin is trading below it at $6633.99. 30 days Exponential Moving Average is indicating Buy action with value at 6551, Bitcoin is trading below it at $6633.99. 200 days Exponential Moving Average is at 7199.7, showing Sell signal, Bitcoin is trading below it at $6633.99.
Other Technical Price Analysis for today:
Bitcoin Cash (BCH) Struggles Near $440-450 Zone - Bitcoin Cash Price Analysis - 15 Oct 2018
Ethereum (ETH) Price Finally Gains Momentum - Ethereum Price Analysis - 15 Oct 2018

