


Bitcoin Cash (BCH) Price Predictions / Bitcoin Cash (BCH) Forecast
| After | Price | Change |
|---|---|---|
| 1 day | $470.7688 | 0.40% |
| 1 week | $477.4904 | 1.83% |
| 1 month | $439.6976 | -6.23% |
| 6 months | $634.6566 | 35.35% |
| 1 year | $1,029.8219 | 119.63% |
| 5 years | $3,404.7266 | 626.11% |
The Relative Strength Index (RSI) is an important indicator for measuring the speed and variation of price movements. Its value ranges from zero and 100. The value around 30 and below is considered an oversold region and over 70 as oversold regions. Relative Strength Index is showing Neutral signal, with value at 46.6.
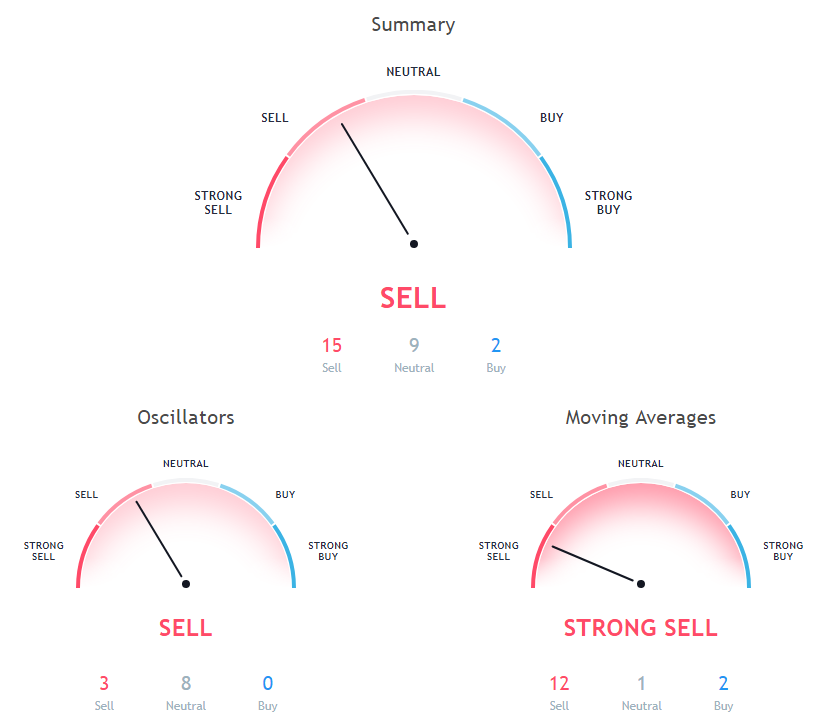
The Stochastic Oscillator is a range bound momentum oscillator. Stochastic oscillator is showing Neutral signal, with value at 24.1.
The Commodity Channel Index (CCI) is a momentum oscillator used in technical analysis to measure an instrument's deviation from its statistical average. Commodity Channel Index is showing Neutral signal, with value at -71.
Moving Average (MA) is just average of any subset of numbers. For example, to calculate a basic 10-day moving average you would add up the closing prices from the past 10 days and then divide the result by 10.
30 days Exponential Moving Average is at 496.8, showing Sell signal, Bitcoin Cash is trading below it at $468.9. 20 days Volume Weighted Moving Average is indicating Sell action with value at 516.6, Bitcoin Cash is trading below it at $468.9. 9 days Hull Moving Average is indicating Buy action with value at 436.9, Bitcoin Cash is trading below it at $468.9.
50 days Simple Moving Average is indicating Sell action with value at 504.2, Bitcoin Cash is trading below it at $468.9. 100 days Exponential Moving Average is at 604.9, showing Sell signal, Bitcoin Cash is trading below it at $468.9. 9 days Ichimoku Cloud Base Line is indicating Neutral since Bitcoin Cash is trading at $468.9, below MAs value of 506.6.
10 days Exponential Moving Average is indicating Sell action with value at 478.2, Bitcoin Cash is trading below it at $468.9. 200 days Simple Moving Average is indicating Sell since Bitcoin Cash is trading at $468.9, below MAs value of 806.6. 20 days Simple Moving Average is at 508.2, showing Sell signal, Bitcoin Cash is trading below it at $468.9.
50 days Exponential Moving Average is indicating Sell since Bitcoin Cash is trading at $468.9, below MAs value of 518.9. 20 days Exponential Moving Average is indicating Sell action with value at 489.7, Bitcoin Cash is trading below it at $468.9. 200 days Exponential Moving Average is indicating Sell action with value at 738.8, Bitcoin Cash is trading below it at $468.9.
Also Read: Future of Cryptocurrencies
100 days Simple Moving Average is indicating Sell since Bitcoin Cash is trading at $468.9, below MAs value of 592.4. 30 days Simple Moving Average is indicating Sell since Bitcoin Cash is trading at $468.9, below MAs value of 491.3. 10 days Simple Moving Average is at 485.5, showing Sell signal, Bitcoin Cash is trading below it at $468.9.
Other Technical Price Analysis for today:
Bitcoin (BTC) Price Rallied Above The $6,600 And $6,700 - Bitcoin Price Analysis - 15 Oct 2018
Ethereum (ETH) Price Finally Gains Momentum - Ethereum Price Analysis - 15 Oct 2018

