


Bitcoin (BTC) Price Predictions / Bitcoin (BTC) Forecast
| After | Price | Change |
|---|---|---|
| 1 day | $4,037.3167 | 0.75% |
| 1 week | $4,031.2775 | 0.60% |
| 1 month | $4,105.7621 | 2.46% |
| 6 months | $4,491.8505 | 12.09% |
| 1 year | $6,984.1213 | 74.29% |
| 5 years | $21,721.4626 | 442.06% |
The stochastic oscillator is a momentum indicator that compares the closing price of a security with the price range over a specific period. Stochastic oscillator is indicating Neutral action, with value at 22.7.
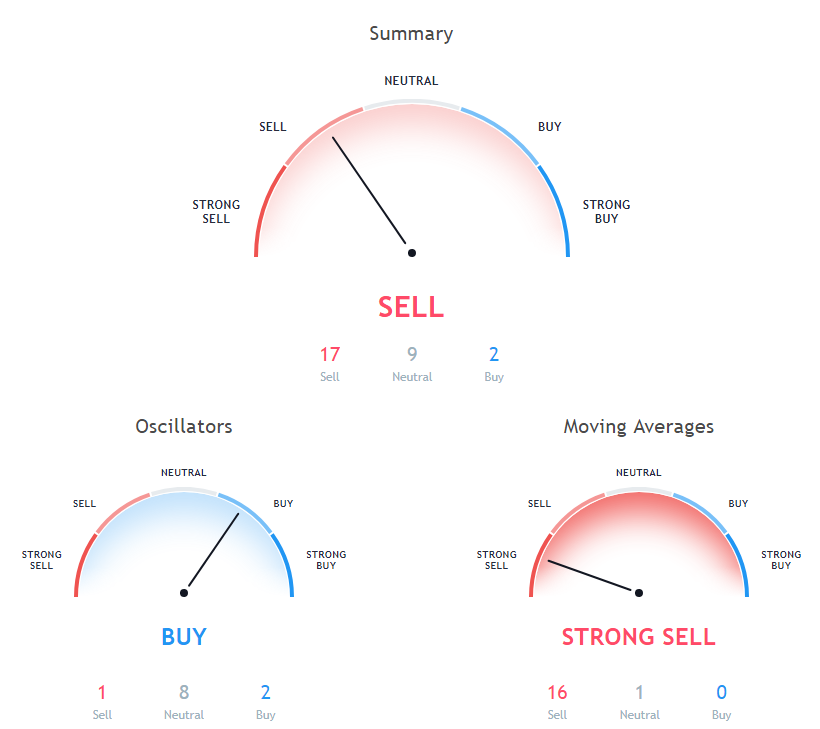
The Commodity Channel Index (CCI) is a momentum oscillator used in technical analysis to measure an instrument's deviation from its statistical average. Commodity Channel Index is indicating Neutral action, with value at -70.
The Relative Strength Index (RSI) is an important indicator for measuring the speed and variation of price movements. Its value ranges from zero and 100. The value around 30 and below is considered an oversold region and over 70 as oversold regions. Relative Strength Index is showing Neutral signal, with value at 27.8.
5 days Simple Moving Average is indicating Sell since Bitcoin is trading at $4007.19, below MAs value of 4118.3. 9 days Ichimoku Cloud Base Line is indicating Neutral action with value at 5136.3, Bitcoin is trading below it at $4007.19. 10 days Exponential Moving Average is indicating Sell since Bitcoin is trading at $4007.19, below MAs value of 4281.
30 days Exponential Moving Average is indicating Sell action with value at 5075.9, Bitcoin is trading below it at $4007.19. 50 days Simple Moving Average is at 5839.3, showing Sell signal, Bitcoin is trading below it at $4007.19. 20 days Volume Weighted Moving Average is indicating Sell action with value at 4616.7, Bitcoin is trading below it at $4007.19.
20 days Simple Moving Average is indicating Sell action with value at 4847.1, Bitcoin is trading below it at $4007.19. 200 days Exponential Moving Average is indicating Sell action with value at 6629, Bitcoin is trading below it at $4007.19. 100 days Simple Moving Average is indicating Sell action with value at 6235, Bitcoin is trading below it at $4007.19.
5 days Exponential Moving Average is at 4114.6, showing Sell signal, Bitcoin is trading below it at $4007.19. 30 days Simple Moving Average is indicating Sell action with value at 5386.3, Bitcoin is trading below it at $4007.19. 50 days Exponential Moving Average is at 5504.8, showing Sell signal, Bitcoin is trading below it at $4007.19.
9 days Hull Moving Average is at 4184.3, showing Sell signal, Bitcoin is trading below it at $4007.19. 10 days Simple Moving Average is indicating Sell action with value at 4126.7, Bitcoin is trading below it at $4007.19. 200 days Simple Moving Average is at 6618.4, showing Sell signal, Bitcoin is trading below it at $4007.19.
Also Read: Top 10 Best Bitcoin Payment Gateways of 2018
100 days Exponential Moving Average is indicating Sell action with value at 6038, Bitcoin is trading below it at $4007.19. 20 days Exponential Moving Average is at 4731, showing Sell signal, Bitcoin is trading below it at $4007.19.
Other Technical Price Analysis for today:
Litecoin (LTC) Price Down By 6% - Litecoin Price Analysis - 1 Dec 2018
Tron (TRX) Performs Well Despite Altcoin Slowdown - Tron Price Analysis - 1 Dec 2018

