


Bitcoin (BTC) Price Predictions / Bitcoin (BTC) Forecast
| After | Price | Change |
|---|---|---|
| 1 day | $6,994.8647 | 0.12% |
| 1 week | $7,006.7344 | 0.29% |
| 1 month | $7,029.0207 | 0.61% |
| 6 months | $7,655.6823 | 9.58% |
| 1 year | $10,142.4759 | 45.17% |
| 5 years | $24,315.3103 | 248.03% |
We've applied Technical Analysis to the price of Bitcoin (BTC/USD) for today and predict where price is headed.
The Relative Strength Index (RSI) is an important indicator for measuring the speed and variation of price movements. Its value ranges from zero and 100. The value around 30 and below is considered an oversold region and over 70 as oversold regions. Relative Strength Index is indicating Neutral action, with value at 55.9.
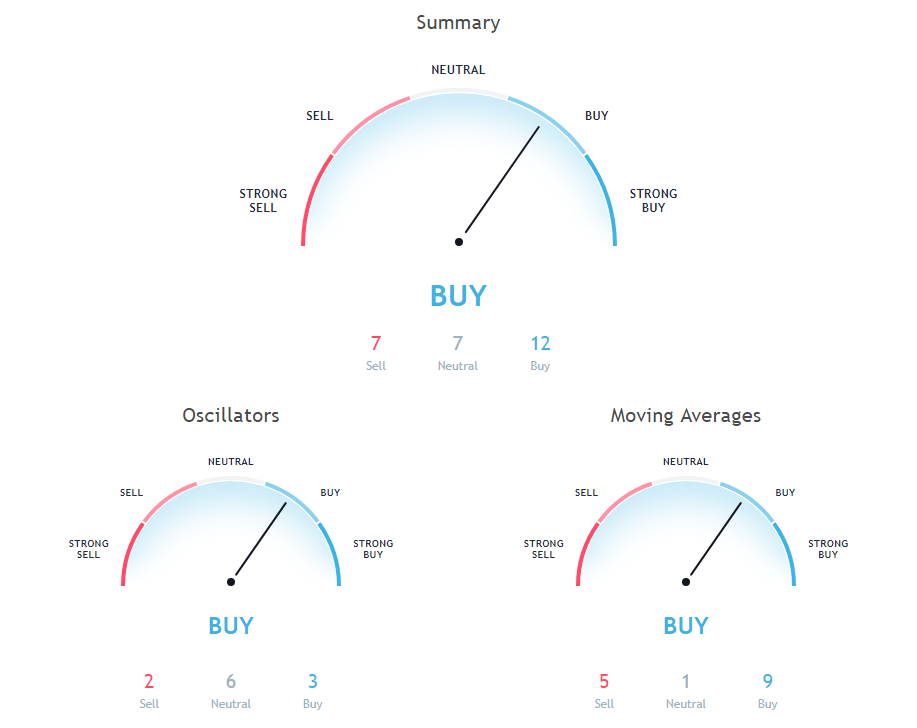
The Commodity Channel Index (CCI) is a momentum-based technical trading tool used to determine when a market is overbought or oversold. Commodity Channel Index is at 105.1, indicating Sell action.
The Stochastic Oscillator is a range bound momentum oscillator. Stochastic oscillator is showing Neutral signal, with value at 84.7.
10 days Exponential Moving Average is indicating Buy since Bitcoin is trading at $6986.56, below MAs value of 6837.8. 20 days Volume Weighted Moving Average is indicating Buy since Bitcoin is trading at $6986.56, below MAs value of 6500.9. 200 days Simple Moving Average is at 7870.5, showing Sell signal, Bitcoin is trading below it at $6986.56.
20 days Simple Moving Average is indicating Buy since Bitcoin is trading at $6986.56, below MAs value of 6577.4. 30 days Simple Moving Average is indicating Buy action with value at 6646.5, Bitcoin is trading below it at $6986.56. 9 days Hull Moving Average is indicating Sell since Bitcoin is trading at $6986.56, below MAs value of 7103.7.
20 days Exponential Moving Average is indicating Buy since Bitcoin is trading at $6986.56, below MAs value of 6763.2. 10 days Simple Moving Average is indicating Buy action with value at 6801.1, Bitcoin is trading below it at $6986.56. 100 days Exponential Moving Average is indicating Sell since Bitcoin is trading at $6986.56, below MAs value of 7133.1.
50 days Exponential Moving Average is indicating Buy action with value at 6849.4, Bitcoin is trading below it at $6986.56. 50 days Simple Moving Average is indicating Sell action with value at 6992.7, Bitcoin is trading below it at $6986.56. 100 days Simple Moving Average is indicating Buy action with value at 6900.5, Bitcoin is trading below it at $6986.56.
Also Read: Best Bitcoin Cloud Mining Platforms of 2018
30 days Exponential Moving Average is indicating Buy action with value at 6779.8, Bitcoin is trading below it at $6986.56. 200 days Exponential Moving Average is indicating Sell action with value at 7559.4, Bitcoin is trading below it at $6986.56. 9 days Ichimoku Cloud Base Line is indicating Neutral since Bitcoin is trading at $6986.56, below MAs value of 6506.1.
Other Technical Price Analysis for today:
Monero (XMR/USD) Price Prediction via Technical Analysis for 31 August 2018
NEO (NEO/USD) Price Prediction via Technical Analysis for 31 August 2018

