


We're going to predict bitcoin price and see where is it headed this week by applying Technical Analysis to timeframes of 1 hour and 4 hours charts.
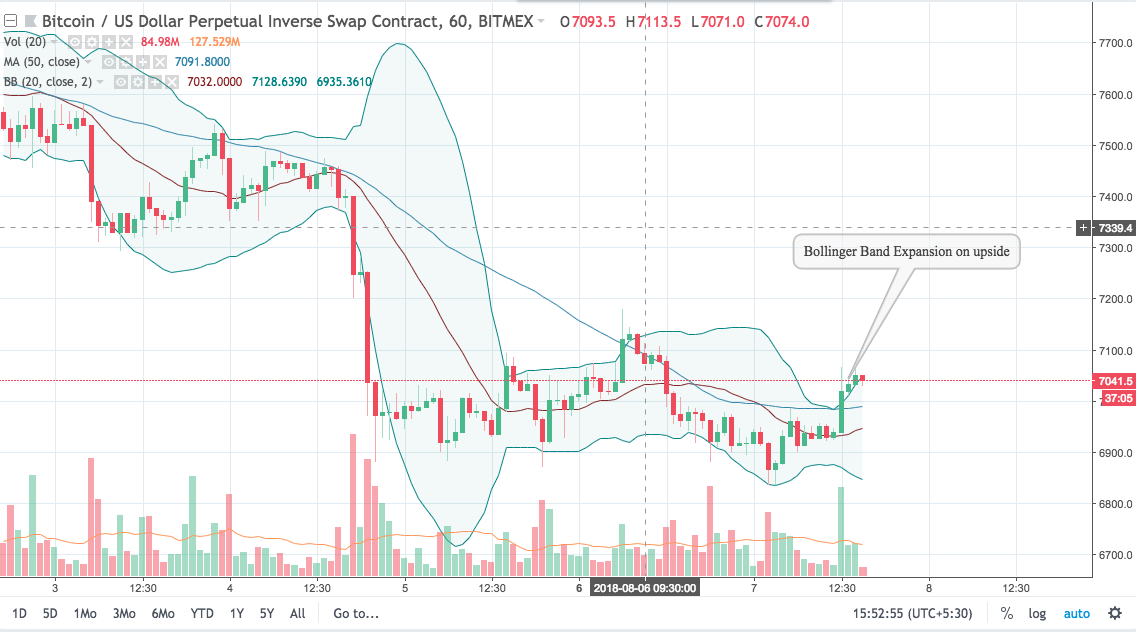
Bollinger Band Expansion on the upside
As below chart shows, applying Bollinger Band to 1-hour timeframe shows that bitcoin price is pushing on the upside and hence Bollinger Band is expanding on the upside. This indicates price going upward with more volatility.
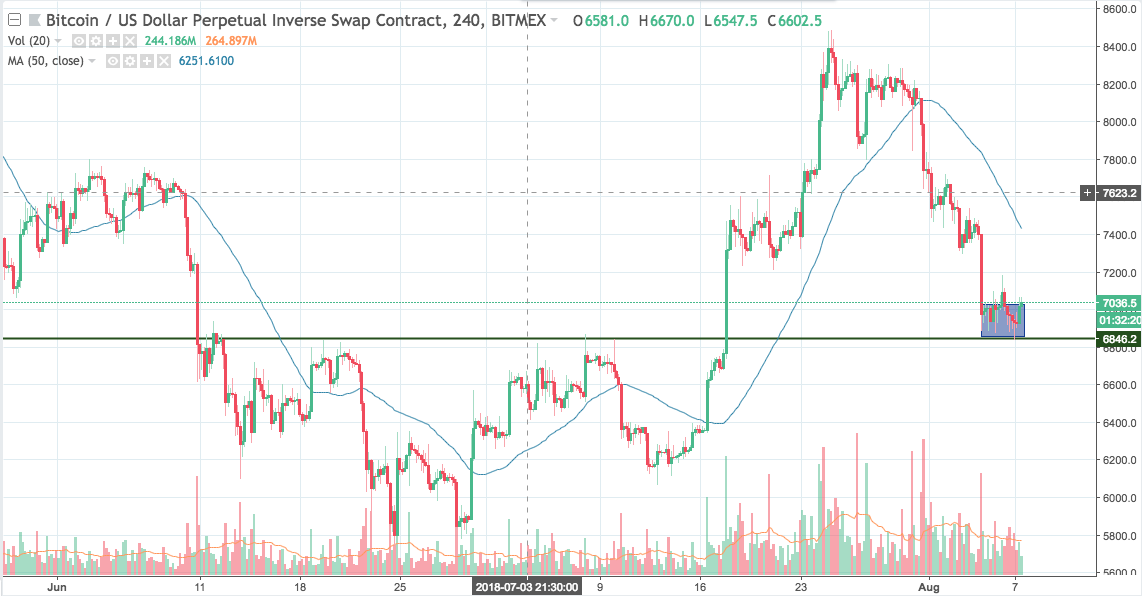
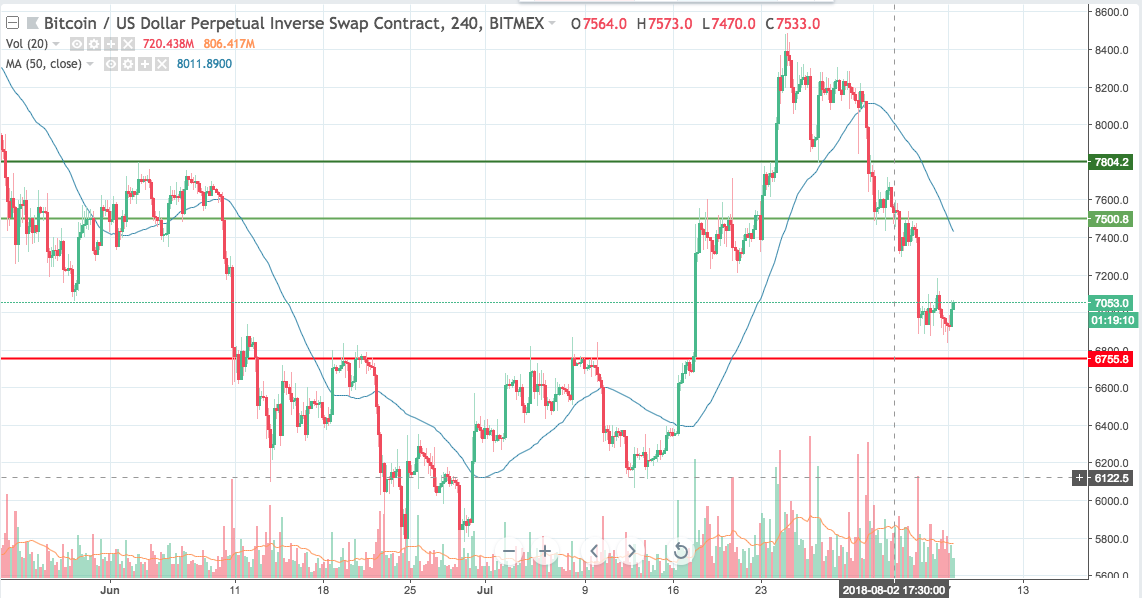
Bitcoin consolidated at previous multi-time tested resistance
As you can see in the below 4-hour chart, Bitcoin has consolidated in the range of $200 above $6800 for the last couple of days. As you can see in the chart, the $6800 level was previously tested around 5 times since mid-June, before finally being taken out in around 17th July. The more a level gets tested, the stronger it becomes, hence it was a strong resistance. Now Bitcoin has refused to go below this resistance and has consolidated at that level and is showing signs of breakout on the upside. This is an extremely good sign for Bitcoin price and we'll see below how we can trade with it.
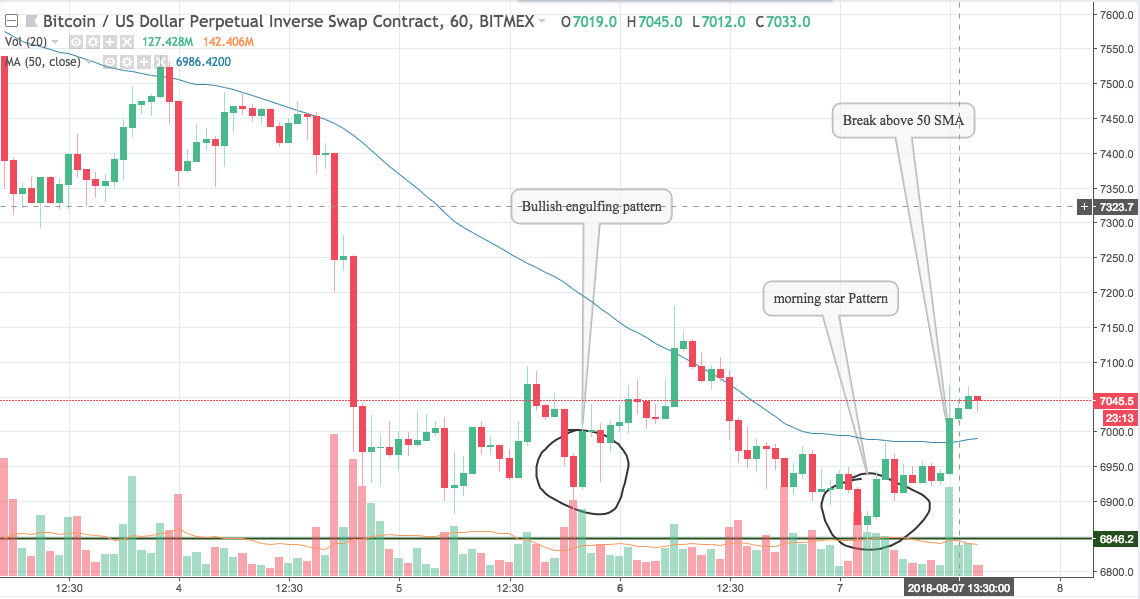
Bullish engulfing pattern, Morning star pattern
In the chart below, we've zoomed the consolidated area from the above chart, hence below chart is 1-hour timeframe chart. As you can see in the chart, Bitcoin has multiple bullish candlesticks patterns during this consolidation.
The first one if the Bullish Engulfing pattern. It's a multiple candlesticks pattern, where the first candle is red in a downtrend, followed by a green candle which engulfs the red candle.
The second one is the Morning Star pattern. It's also a multiple candlesticks pattern, where the first candle is a red one, followed by a green candle which opened below the previous candles low but closes in green, and then the third candle is a green which closes above the first candle. This is a bullish pattern.
After consolidation above resistance turned support at $6800, with the bullish candlestick patterns, we predict that Bitcoin is now ready to move up, and recommending a trade below.
Bitcoin to climb above $8000 this week
We predict that Bitcoin will break $8000 level this week. A trader should go long at current levels with StopLoss at $6755, first target at $7500 and second target at $7800. Risk-reward for this trades are 1:2 and 1:5.
Disclaimer: Views expressed here are those of the author and aren’t an investment or trading advice. Trading involves risk and so do your due diligence before making a trading decision.

