


In this post, we're going to apply Technical Analysis to Stellar (XLM) price chart and try to predict where its price is headed.
Chart Bullish compare to other cryptocurrencies
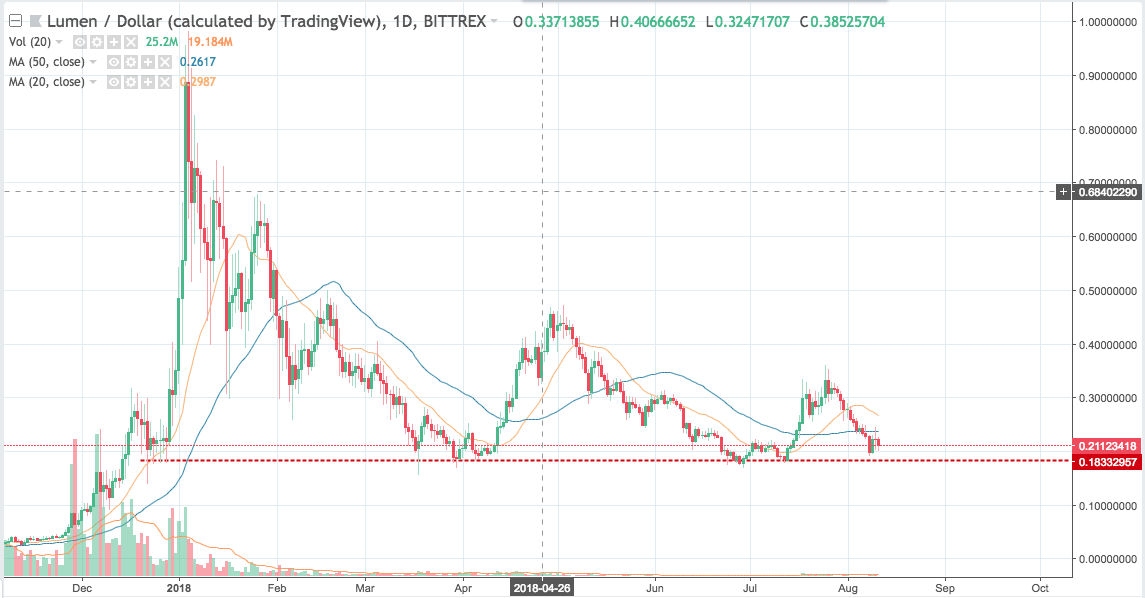
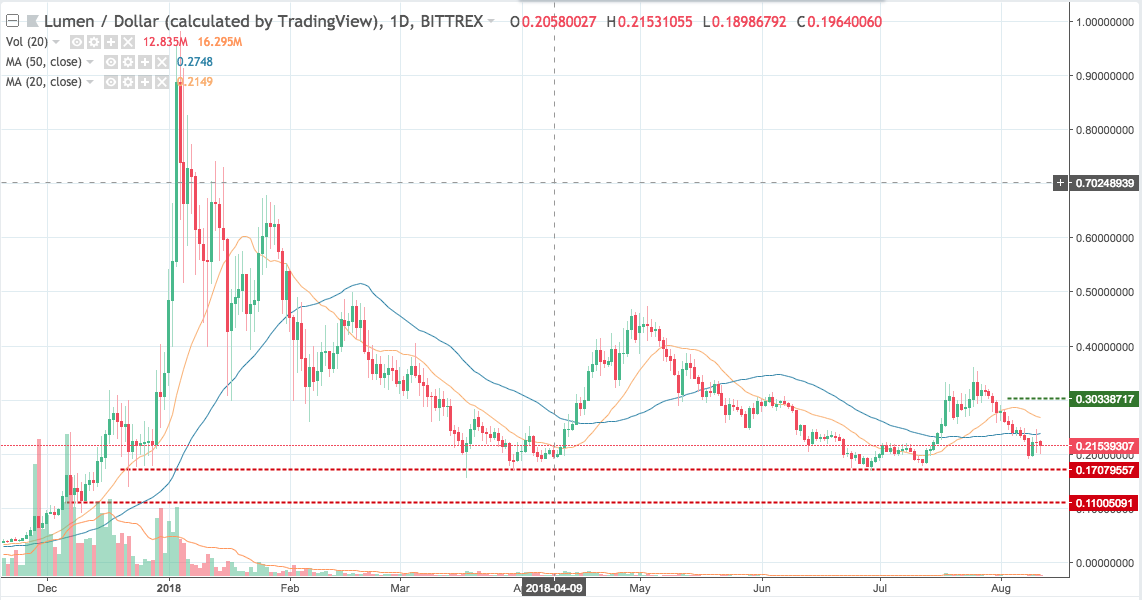
As we can see in the chart below, Stellar chart looks much more bullish than that of other cryptocurrencies. It is still trading above its long-term strong support at ~$0.183. Bears have tried to take the price down a couple of times, but are unable to do so. Bulls have come back strongly on August 9, and chart is making higher highs.
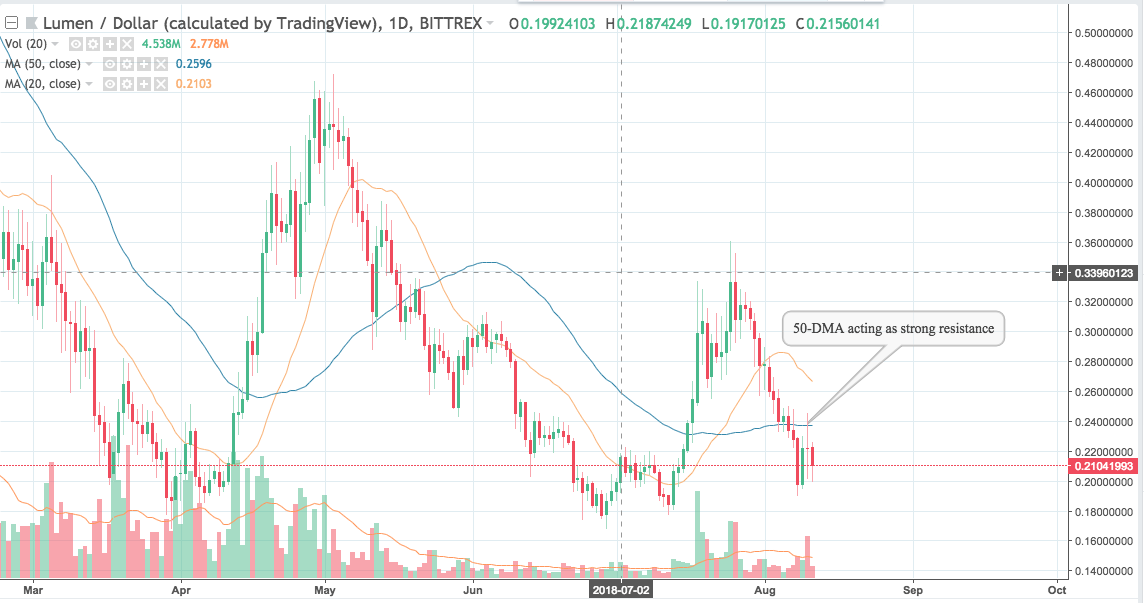
50-DMA acting as strong resistance
Below is a 1-day chart of Stellar. As you can see in the chart, the 50-day Moving Average is acting as a strong resistance. Bulls tried to break the resistance but were unable to do so. However, bears are not able to take the price down below low of 8th August, which is a good sign that resistance will soon be crossed.
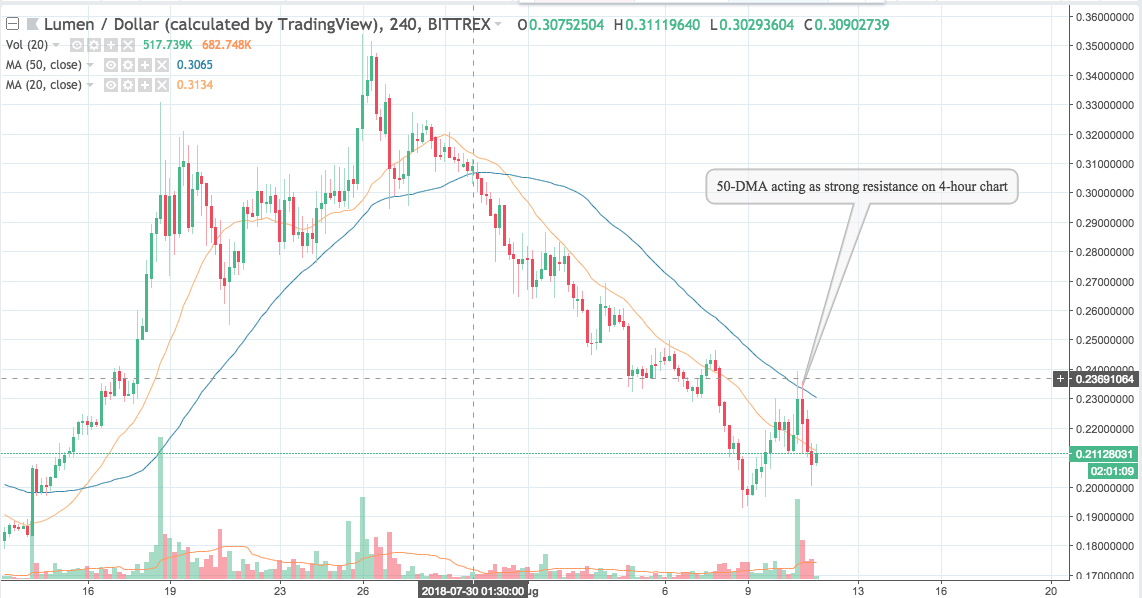
Below is a 4-hour chart of Stellar. As you can see in the chart, 50-day Moving Average is acting strong resistance in this timeframe as well. Bulls tried to cross it with large volume bar as visible in the chart.
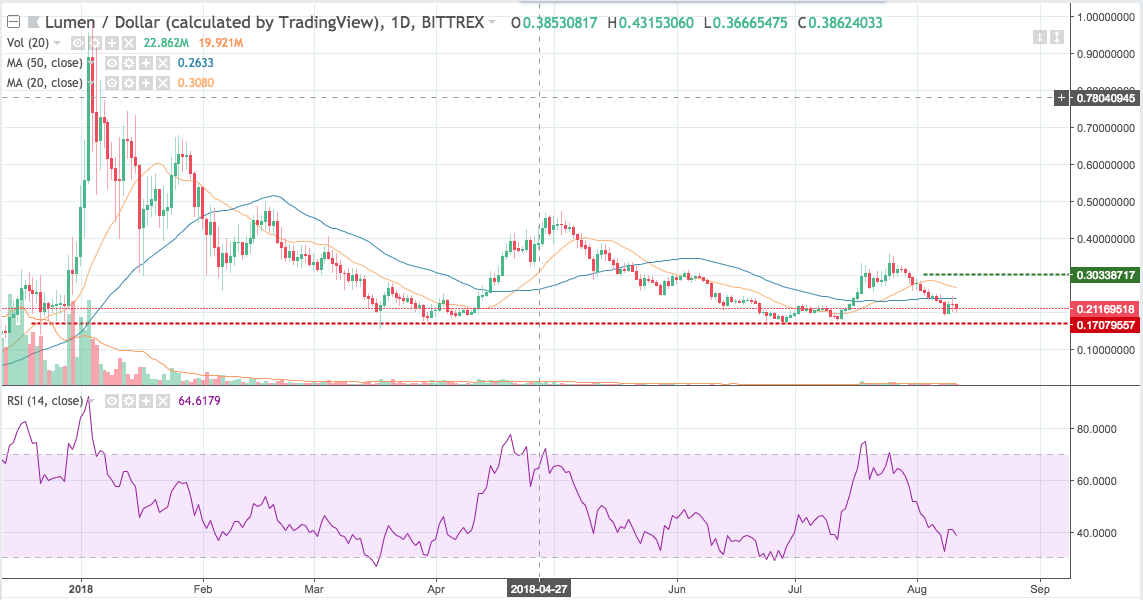
Stellar price can raise 50% to levels of $0.30
We're seeing bullish signs on Stellar chart. RSI is also at oversold levels. However, if long-term strong support at $0.17 is broken then the price can test the levels of $0.11, so traders must follow StopLoss with discipline.
We're going long once XLM crosses 50-day moving average and sustains there, with StopLoss at $0.1707 and Target at $0.3033. Risk-reward for this trade is ~1:2.
Disclaimer: Views expressed here are those of the author and aren’t an investment or trading advice. Trading involves risk and so do your due diligence before making a trading decision.

