


Technical analysis is a sub-discipline of trading which is used to evaluate securities with various tools and identify trading opportunities.
Monero (XMR) Price Predictions / Monero (XMR) Forecast
| After | Price | Change |
|---|---|---|
| 1 day | $115.1749 | 0.85% |
| 1 week | $116.1880 | 1.74% |
| 1 month | $114.7539 | 0.48% |
| 6 months | $143.6476 | 25.79% |
| 1 year | $204.1716 | 78.78% |
| 5 years | $585.8034 | 412.96% |
We've applied Technical Analysis to the price of Monero (XMR/USD) for today and predict where price is headed.
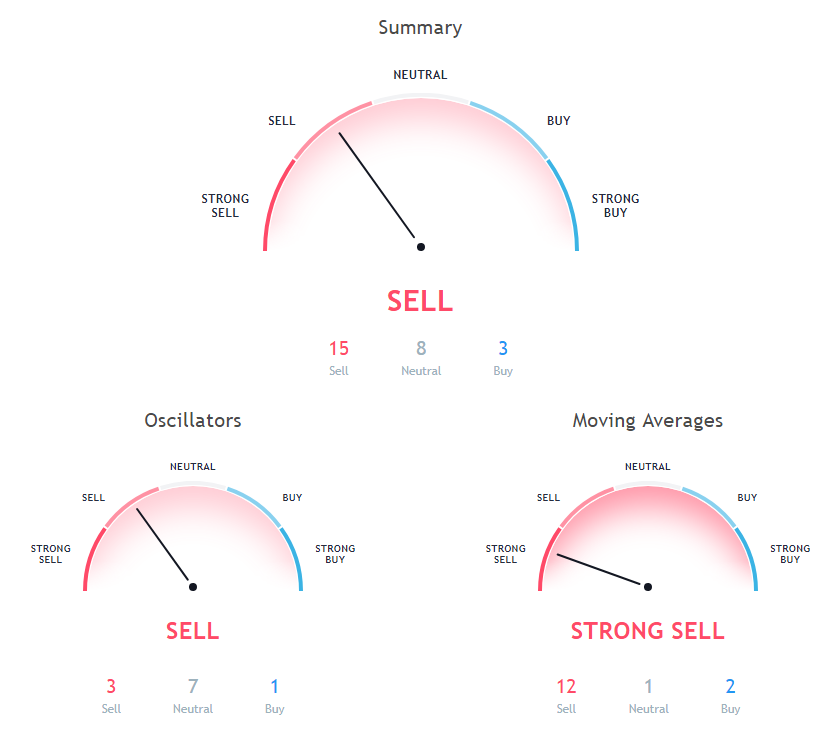
The Stochastic Oscillator is a range bound momentum oscillator. Stochastic oscillator is at 43.571, indicating Neutral action.
The Commodity Channel Index (CCI) is a momentum oscillator used in technical analysis to measure an instrument's deviation from its statistical average. Commodity Channel Index is indicating Neutral action, with value at -63.873.
The Relative Strength Index (RSI) is an important indicator for measuring the speed and variation of price movements. Its value ranges from zero and 100. The value around 30 and below is considered an oversold region and over 70 as oversold regions. Relative Strength Index is at 49.669, indicating Neutral action.
Moving Average (MA) in simple term is just average of any subset of numbers. For example, 50 Days simple moving average is calculated at any point in chart by summing past 50 days of price and then dividing it by 50.
20 days Exponential Moving Average is at 114.987, showing Sell signal, Monero is trading below it at $114.2. 10 days Exponential Moving Average is at 114.959, showing Sell signal, Monero is trading below it at $114.2. 200 days Simple Moving Average is indicating Sell action with value at 149.922, Monero is trading below it at $114.2.
50 days Exponential Moving Average is indicating Sell since Monero is trading at $114.2, below MAs value of 114.514. 30 days Simple Moving Average is at 114.676, showing Sell signal, Monero is trading below it at $114.2. 20 days Volume Weighted Moving Average is at 117.521, showing Sell signal, Monero is trading below it at $114.2.
50 days Simple Moving Average is indicating Buy since Monero is trading at $114.2, below MAs value of 111.954. 20 days Simple Moving Average is at 116.623, showing Sell signal, Monero is trading below it at $114.2. 30 days Exponential Moving Average is at 114.497, showing Sell signal, Monero is trading below it at $114.2.
9 days Hull Moving Average is at 114.129, showing Buy signal, Monero is trading below it at $114.2. 100 days Exponential Moving Average is indicating Sell since Monero is trading at $114.2, below MAs value of 122.875. 200 days Exponential Moving Average is at 143.718, showing Sell signal, Monero is trading below it at $114.2.
Also Read: Best Cryptocurrency To Invest in 2018 with Detailed Analysis
10 days Simple Moving Average is indicating Sell since Monero is trading at $114.2, below MAs value of 114.955. 100 days Simple Moving Average is indicating Sell since Monero is trading at $114.2, below MAs value of 116.44. 9 days Ichimoku Cloud Base Line is at 115.92, showing Neutral signal, Monero is trading below it at $114.2.
Other Technical Price Analysis for today:
Bitcoin (BTC) Next Level Watch on the Upside is $7,400 - Bitcoin Price Analysis - 9 Oct 2018
Ethereum (ETH) Traders Wait For a Reliable Buy Setup - Ethereum Price Analysis - 9 Oct 2018

