


Bitcoin Cash (BCH) Price Predictions / Bitcoin Cash (BCH) Forecast
| After | Price | Change |
|---|---|---|
| 1 day | $455.7980 | 0.70% |
| 1 week | $460.7387 | 1.79% |
| 1 month | $463.1286 | 2.32% |
| 6 months | $658.9639 | 45.59% |
| 1 year | $1,052.5873 | 132.55% |
| 5 years | $3,426.4350 | 657.02% |
The Stochastic Oscillator is a range bound momentum oscillator. Stochastic oscillator is indicating Neutral action, with value at 35.5.
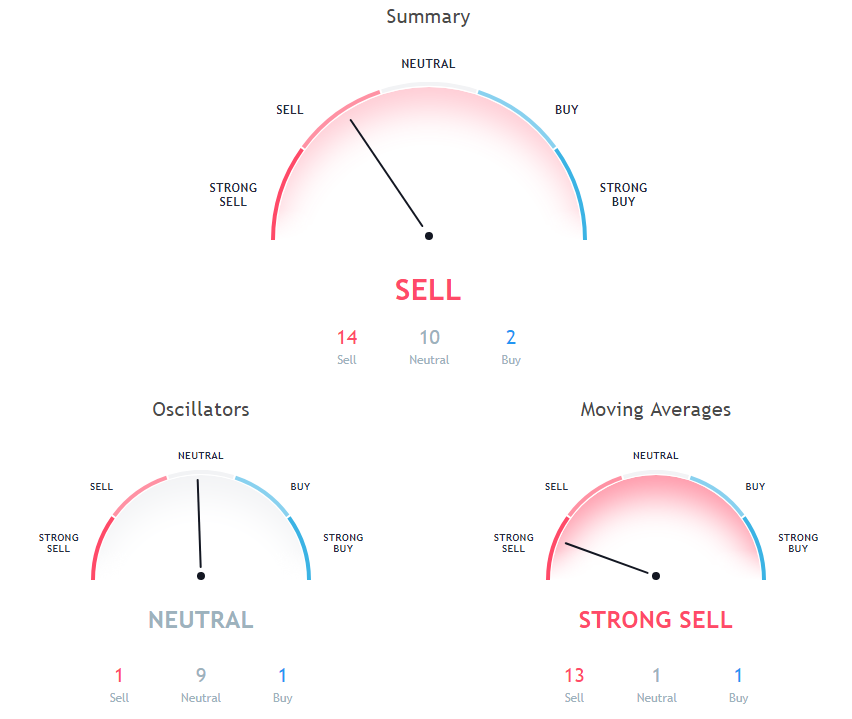
The Commodity Channel Index (CCI) is a momentum-based technical trading tool used to determine when a market is overbought or oversold. Commodity Channel Index is showing Neutral signal, with value at -72.2.
Relative Strength Index (RSI) is an important indicator that measures speed and change of price movements. Its value ranges between zero and 100. Value around 30 and below is considered oversold region and around 70 and above considered overbought regions. Relative Strength Index is showing Neutral signal, with value at 44.1.
Moving Average (MA) in simple term is just average of any subset of numbers. For example, 50 Days simple moving average is calculated at any point in chart by summing past 50 days of price and then dividing it by 50.
200 days Exponential Moving Average is indicating Sell action with value at 733.3, Bitcoin Cash is trading below it at $452.62. 20 days Simple Moving Average is at 500.5, showing Sell signal, Bitcoin Cash is trading below it at $452.62. 50 days Exponential Moving Average is indicating Sell action with value at 514.7, Bitcoin Cash is trading below it at $452.62.
20 days Volume Weighted Moving Average is at 500.3, showing Sell signal, Bitcoin Cash is trading below it at $452.62. 100 days Simple Moving Average is indicating Sell since Bitcoin Cash is trading at $452.62, below MAs value of 586.9. 20 days Exponential Moving Average is indicating Sell since Bitcoin Cash is trading at $452.62, below MAs value of 485.1.
9 days Hull Moving Average is indicating Buy since Bitcoin Cash is trading at $452.62, below MAs value of 462.3. 10 days Simple Moving Average is indicating Sell since Bitcoin Cash is trading at $452.62, below MAs value of 475. 30 days Simple Moving Average is indicating Sell action with value at 493.2, Bitcoin Cash is trading below it at $452.62.
200 days Simple Moving Average is at 804.4, showing Sell signal, Bitcoin Cash is trading below it at $452.62. 9 days Ichimoku Cloud Base Line is indicating Neutral since Bitcoin Cash is trading at $452.62, below MAs value of 506.8. 100 days Exponential Moving Average is at 599.4, showing Sell signal, Bitcoin Cash is trading below it at $452.62.
Also Read: Ultimate Cryptocurrency Mining Guide
30 days Exponential Moving Average is at 492.7, showing Sell signal, Bitcoin Cash is trading below it at $452.62. 10 days Exponential Moving Average is at 473.6, showing Sell signal, Bitcoin Cash is trading below it at $452.62. 50 days Simple Moving Average is indicating Sell action with value at 500.4, Bitcoin Cash is trading below it at $452.62.
Other Technical Price Analysis for today:
Bitcoin (BTC) Technical Indicators Show Mixed Signals - Bitcoin Price Analysis - 17 Oct 2018
Is Reversal In Works For Monero (XMR) Price? - Monero Price Analysis - 17 Oct 2018

