


Technical analysis is done by analyzing data gathered from historical trading activity, such as volume, price movement, open, close etc.
Monero (XMR) Price Predictions / Monero (XMR) Forecast
| After | Price | Change |
|---|---|---|
| 1 day | $105.8772 | 0.24% |
| 1 week | $105.6858 | 0.06% |
| 1 month | $107.2792 | 1.57% |
| 6 months | $135.6900 | 28.47% |
| 1 year | $197.5258 | 87.02% |
| 5 years | $580.9080 | 450.00% |
We've applied Technical Analysis to the price of Monero (XMR/USD) for today and predict where price is headed.
The Stochastic Oscillator is a range bound momentum oscillator. Stochastic oscillator is showing Neutral signal, with value at 22.825.
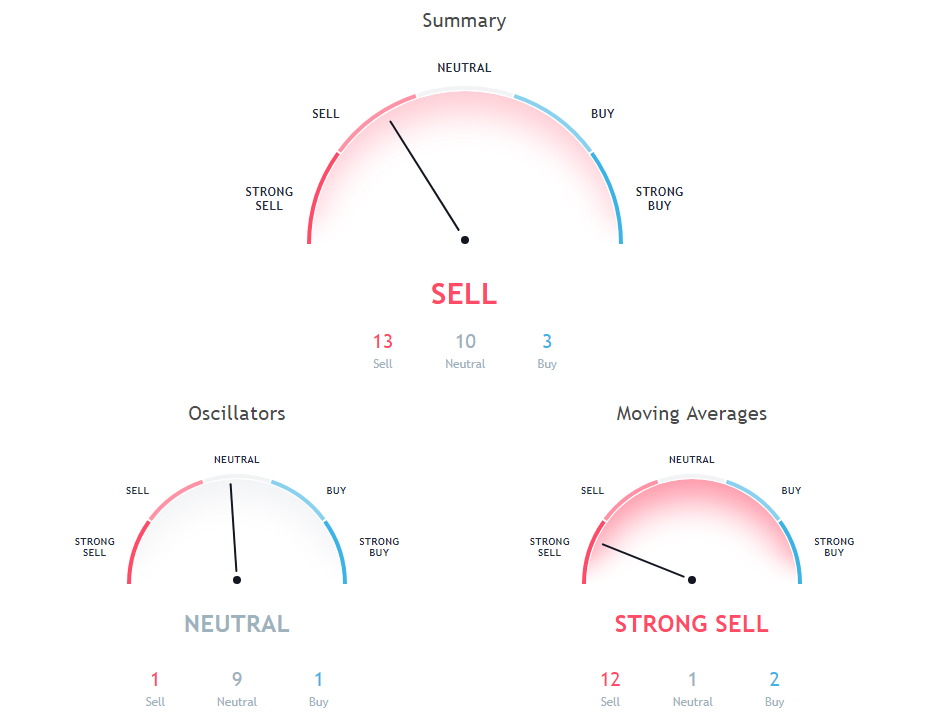
The Commodity Channel Index (CCI) is a momentum-based technical trading tool used to determine when a market is overbought or oversold. Commodity Channel Index is indicating Neutral action, with value at -17.885.
Relative Strength Index (RSI) is an important indicator that measures speed and change of price movements. Its value ranges between zero and 100. Value around 30 and below is considered oversold region and around 70 and above considered overbought regions. Relative Strength Index is indicating Neutral action, with value at 47.088.
Moving Average (MA) is just average of any subset of numbers. For example, to calculate a basic 10-day moving average you would add up the closing prices from the past 10 days and then divide the result by 10.
10 days Simple Moving Average is indicating Sell action with value at 117.16, Monero is trading below it at $105.62. 9 days Ichimoku Cloud Base Line is at 114.154, showing Neutral signal, Monero is trading below it at $105.62. 50 days Simple Moving Average is at 110.63, showing Sell signal, Monero is trading below it at $105.62.
100 days Exponential Moving Average is indicating Sell since Monero is trading at $105.62, below MAs value of 128.949. 20 days Simple Moving Average is indicating Sell action with value at 108.413, Monero is trading below it at $105.62. 20 days Volume Weighted Moving Average is indicating Sell action with value at 116.566, Monero is trading below it at $105.62.
20 days Exponential Moving Average is at 109.934, showing Sell signal, Monero is trading below it at $105.62. 100 days Simple Moving Average is indicating Sell since Monero is trading at $105.62, below MAs value of 121.963. 200 days Exponential Moving Average is indicating Sell since Monero is trading at $105.62, below MAs value of 153.354.
200 days Simple Moving Average is indicating Sell action with value at 172.452, Monero is trading below it at $105.62. 30 days Exponential Moving Average is indicating Sell since Monero is trading at $105.62, below MAs value of 109.71. 10 days Exponential Moving Average is indicating Sell since Monero is trading at $105.62, below MAs value of 111.074.
Also Read: Ultimate Cryptocurrency Exchange Guide
9 days Hull Moving Average is indicating Buy since Monero is trading at $105.62, below MAs value of 99.869. 50 days Exponential Moving Average is indicating Sell action with value at 112.901, Monero is trading below it at $105.62. 30 days Simple Moving Average is at 103.247, showing Buy signal, Monero is trading below it at $105.62.
Other Technical Price Analysis for today:
Bitcoin Cash (BCH/USD) Price Prediction via Technical Analysis for 10 September 2018

