


Ethereum (ETH) Price Predictions / Ethereum (ETH) Forecast
| After | Price | Change |
|---|---|---|
| 1 day | $105.2633 | 0.09% |
| 1 week | $106.4772 | 1.24% |
| 1 month | $111.2820 | 5.81% |
| 6 months | $188.8518 | 79.57% |
| 1 year | $386.1129 | 267.13% |
| 5 years | $1,488.2100 | 1,315.05% |
The Stochastic Oscillator is a range bound momentum oscillator. Stochastic oscillator is indicating Neutral action, with value at 8.24.
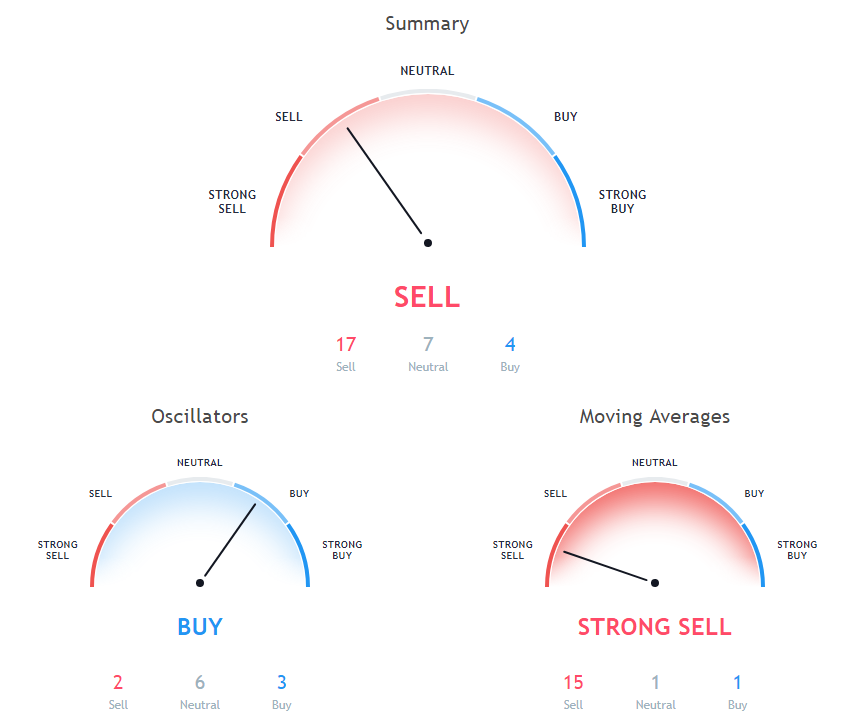
Relative Strength Index (RSI) is an important indicator that measures speed and change of price movements. Its value ranges between zero and 100. Value around 30 and below is considered oversold region and around 70 and above considered overbought regions. Relative Strength Index is at 17.4, indicating Buy action.
The Commodity Channel Index (CCI) is a momentum-based technical trading tool used to determine when a market is overbought or oversold. Commodity Channel Index is at -107.82, indicating Buy action.
50 days Exponential Moving Average is indicating Sell since Ethereum is trading at $105.17, below MAs value of 185.44. 200 days Exponential Moving Average is at 321.65, showing Sell signal, Ethereum is trading below it at $105.17. 200 days Simple Moving Average is indicating Sell since Ethereum is trading at $105.17, below MAs value of 353.73.
20 days Exponential Moving Average is indicating Sell since Ethereum is trading at $105.17, below MAs value of 152.92. 30 days Exponential Moving Average is indicating Sell since Ethereum is trading at $105.17, below MAs value of 166.47. 30 days Simple Moving Average is indicating Sell since Ethereum is trading at $105.17, below MAs value of 178.65.
100 days Exponential Moving Average is indicating Sell action with value at 233.51, Ethereum is trading below it at $105.17. 9 days Hull Moving Average is at 105.89, showing Buy signal, Ethereum is trading below it at $105.17. 10 days Simple Moving Average is indicating Sell action with value at 130.46, Ethereum is trading below it at $105.17.
100 days Simple Moving Average is indicating Sell action with value at 214.94, Ethereum is trading below it at $105.17. 10 days Exponential Moving Average is at 130.86, showing Sell signal, Ethereum is trading below it at $105.17. 5 days Exponential Moving Average is indicating Sell since Ethereum is trading at $105.17, below MAs value of 116.33.
50 days Simple Moving Average is indicating Sell since Ethereum is trading at $105.17, below MAs value of 190.1. 5 days Simple Moving Average is at 115.27, showing Sell signal, Ethereum is trading below it at $105.17. 20 days Volume Weighted Moving Average is at 144.22, showing Sell signal, Ethereum is trading below it at $105.17.
Also Read: How to Buy and Sell Cryptocurrency?
9 days Ichimoku Cloud Base Line is indicating Neutral since Ethereum is trading at $105.17, below MAs value of 164.04. 20 days Simple Moving Average is indicating Sell since Ethereum is trading at $105.17, below MAs value of 165.06.
Other Technical Price Analysis for today:

