


Bitcoin (BTC) Price Predictions / Bitcoin (BTC) Forecast
| After | Price | Change |
|---|---|---|
| 1 day | $6,293.0675 | 0.32% |
| 1 week | $6,342.9553 | 1.11% |
| 1 month | $6,347.6332 | 1.19% |
| 6 months | $6,683.4327 | 6.54% |
| 1 year | $9,222.1682 | 47.01% |
| 5 years | $24,055.7539 | 283.47% |
Relative Strength Index (RSI) is an important indicator that measures speed and change of price movements. Its value ranges between zero and 100. Value around 30 and below is considered oversold region and around 70 and above considered overbought regions. Relative Strength Index is indicating Neutral action, with value at 42.2.
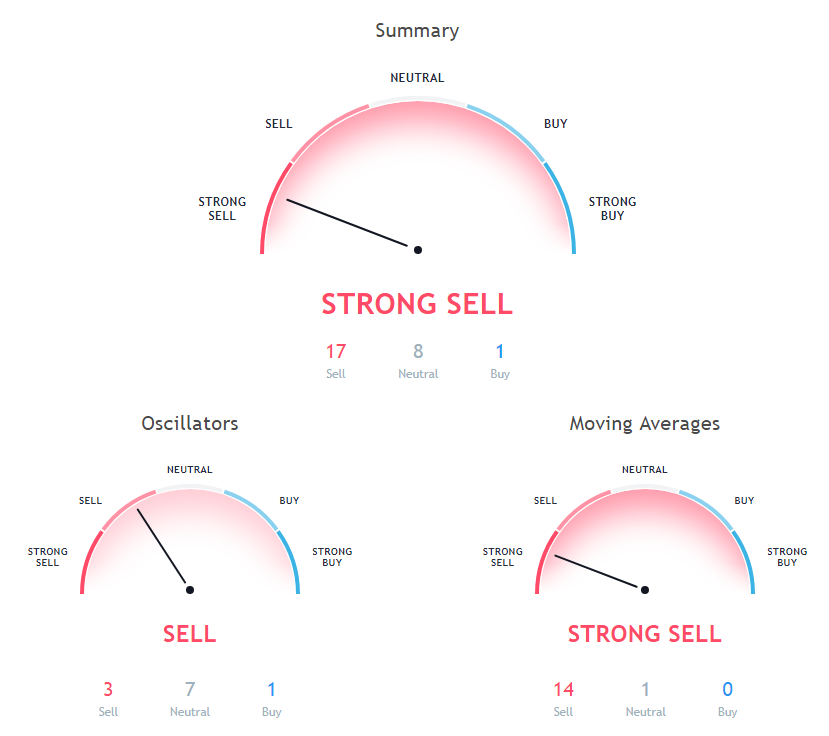
The stochastic oscillator is a momentum indicator that compares the closing price of a security with the price range over a specific period. Stochastic oscillator is showing Neutral signal, with value at 43.8.
The Commodity Channel Index (CCI) is a momentum oscillator used in technical analysis to measure an instrument's deviation from its statistical average. Commodity Channel Index is at -89.6, indicating Neutral action.
Moving Average (MA) in simple term is just average of any subset of numbers. For example, 50 Days simple moving average is calculated at any point in chart by summing past 50 days of price and then dividing it by 50.
50 days Exponential Moving Average is at 6512.3, showing Sell signal, Bitcoin is trading below it at $6273.12. 20 days Volume Weighted Moving Average is indicating Sell action with value at 6436.6, Bitcoin is trading below it at $6273.12. 20 days Simple Moving Average is at 6445.1, showing Sell signal, Bitcoin is trading below it at $6273.12.
50 days Simple Moving Average is indicating Sell action with value at 6517.8, Bitcoin is trading below it at $6273.12. 100 days Exponential Moving Average is at 6653.5, showing Sell signal, Bitcoin is trading below it at $6273.12. 9 days Hull Moving Average is indicating Sell action with value at 6419.7, Bitcoin is trading below it at $6273.12.
200 days Exponential Moving Average is indicating Sell since Bitcoin is trading at $6273.12, below MAs value of 7015.5. 10 days Exponential Moving Average is at 6442.8, showing Sell signal, Bitcoin is trading below it at $6273.12. 10 days Simple Moving Average is indicating Sell since Bitcoin is trading at $6273.12, below MAs value of 6462.1.
9 days Ichimoku Cloud Base Line is indicating Neutral since Bitcoin is trading at $6273.12, below MAs value of 6451.5. 200 days Simple Moving Average is indicating Sell action with value at 7007.7, Bitcoin is trading below it at $6273.12. 30 days Exponential Moving Average is at 6477.1, showing Sell signal, Bitcoin is trading below it at $6273.12.
Also Read: Best Bitcoin Debit Cards of 2018
30 days Simple Moving Average is indicating Sell since Bitcoin is trading at $6273.12, below MAs value of 6496.7. 100 days Simple Moving Average is indicating Sell since Bitcoin is trading at $6273.12, below MAs value of 6541.7. 20 days Exponential Moving Average is indicating Sell action with value at 6460.5, Bitcoin is trading below it at $6273.12.
Other Technical Price Analysis for today:
Cardano (ADA) Price Slowly Moves Lower Below $0.0760 - Bitcoin Price Analysis - 14 Nov 2018
Bitcoin Cash (BCH) Price Mostly Consolidated Near $500- Bitcoin Price Analysis - 14 Nov 2018

