


In this post, we're going to apply Technical Analysis to EOS price chart and try to predict where its price is headed.
Range break out on the downside, price still above crucial support
As we can see in the chart below, EOS has broken down from its range and is expanding in the downside. EOS has been trading inside this range for more than a month now, and hence this breakout is substantial. However, as we can see in the second graph, EOS is still trading above its March low.
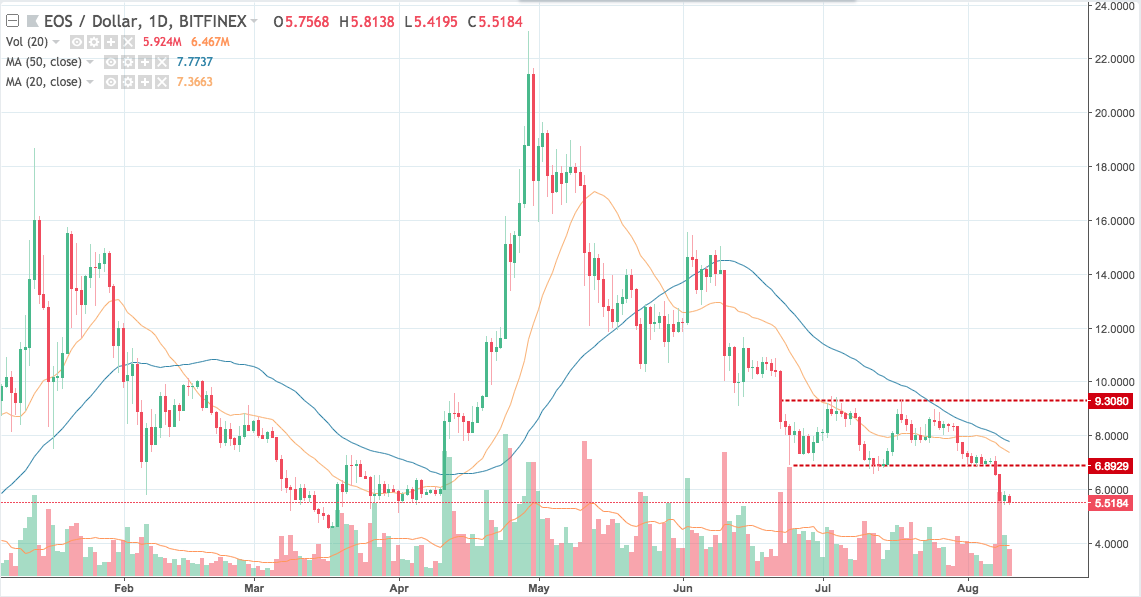
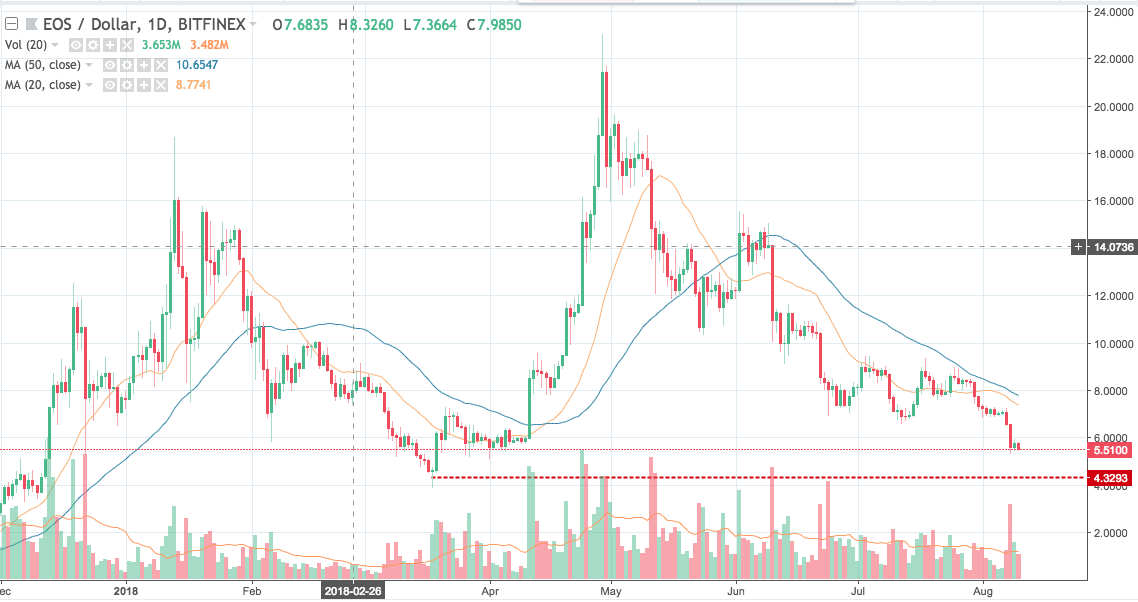
We think as long as EOS stays above its March low of range 4.32, we would see a big bounce back. Though bulls should be cautious below this level. If EOS breaks 4.32, then it can slide quickly to levels of 3.31. EOS is also trading below it's 20-day and 50-day moving average.
Go long on base formation above March low
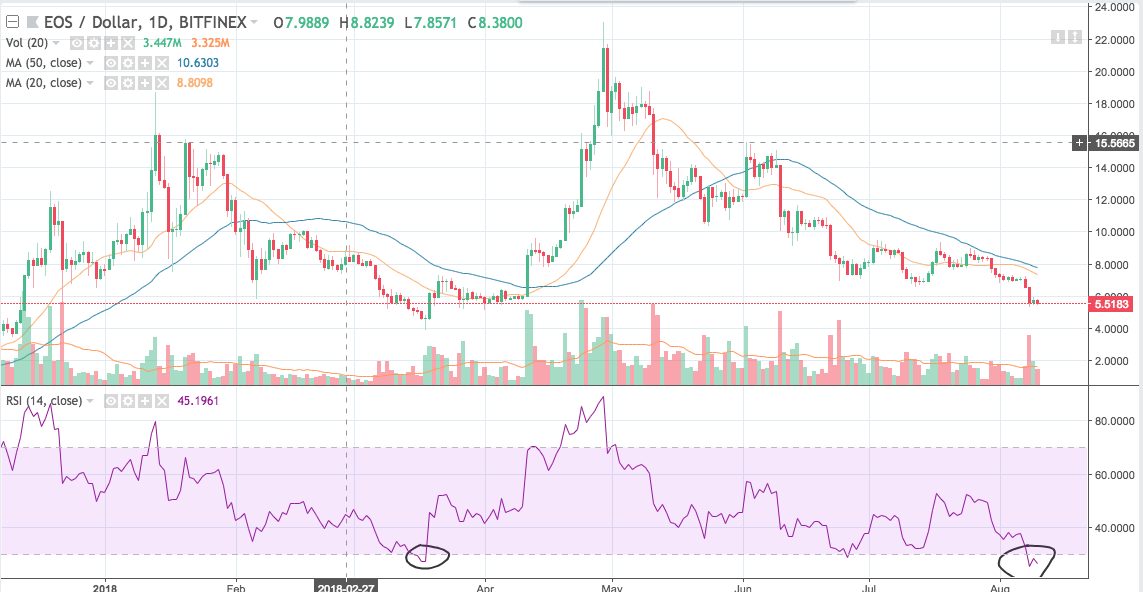
As we can see in the below chart, RSI is in extremely oversold level. Relative Strength Index (RSI) is an important indicator that measures speed and change of price movements. Its value ranges between zero and 100. Value around 30 and below is considered oversold region and around 70 and above considered overbought regions.
Last time it was Mid-March when RSI was at this level. However, EOS had a big bounce back after consolidation at those levels. We think the same can happen this time as well. Hence, trader can go long if EOS consolidates and stays above its March low of 4.32. StopLoss should be if EOS breaks March low. The first target should be 8 and second target should be 10.1. We'll be waiting for consolidation and base formation before taking this trades.
Disclaimer: Views expressed here are those of the author and aren’t an investment or trading advice. Trading involves risk and so do your due diligence before making a trading decision.

